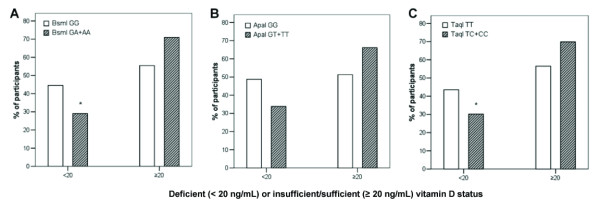
Figure 2.
Frequency of vitamin D deficiency according to BsmI (A), ApaI (B), and TaqI (C) SNPs in VDR gene grouped by presence of polymorphic allele. White bars express the frequency of vitamin D status (deficiency or insufficiency/sufficiency) for the wild genotype of each VDR SNP. Gray bars express the frequency of vitamin D status for the polymorphic (in heterozygous plus homozygous) genotypes. Pearson chi-square test, *p < 0.05.

