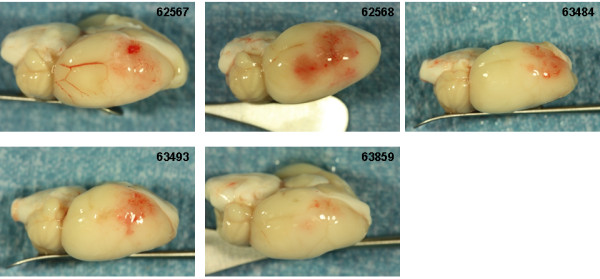
Figure 11.

Scatter plot of the infarct volume of the experimental groups. Rats were subjected to 6 hours middle cerebral artery occlusion followed by 18 hours reflow. Test articles were infused IA over 10 to 60 minutes beginning 1 minute before reflow. * p < 0.05 for the indicated groups (ANOVA, Tukey Kramer HSD; n = 6, 6, 5, 6, 6, 6, 6, 5, respectively). Group values are the mean ± SEM.
