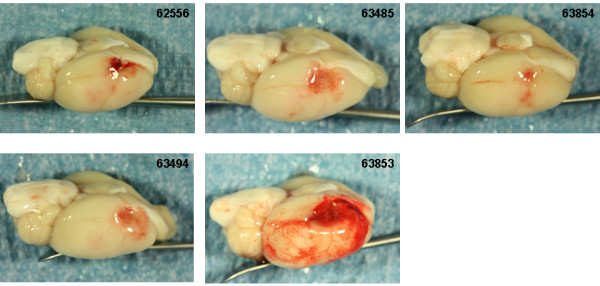
Figure 7.

Brain photographs from the 30 mg/kg rt-PA group. A) Photographs of the gross brain of each rat. B) Representative TTC Stained Sections from each rat. Small blue arrows indicate areas of petechial hemorrhage. Large blue arrows indicate hemorrhagic infarction. Large black arrows indicate hemorrhage to the brain stem (A) or damage to the hypothalamus or pons (B).
