Figure 8.

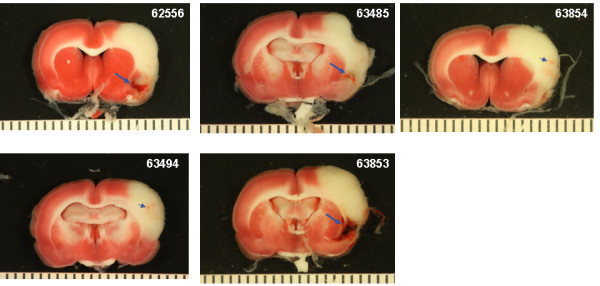
Brain photographs from the 5 mg/kg Δ(K2-K5) plasmin group. A) Photographs of the gross brain of each rat. B) Representative TTC Stained Sections from each rat. Small blue arrows indicate areas of petechial hemorrhage.

Brain photographs from the 5 mg/kg Δ(K2-K5) plasmin group. A) Photographs of the gross brain of each rat. B) Representative TTC Stained Sections from each rat. Small blue arrows indicate areas of petechial hemorrhage.