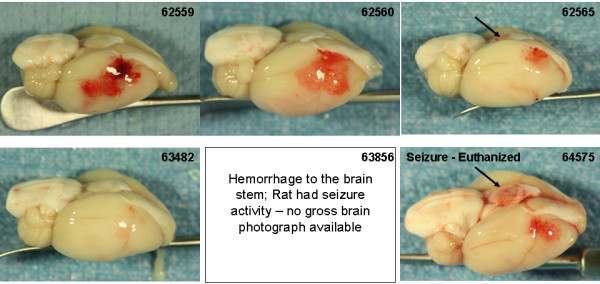
Figure 9.

Box-Whisker Plot of the Bleeding Score. * p < 0.05 for the indicated groups (Kruskal-Wallis ANOVA, Newman-Keuls multiple comparison test for non-parametric data; n = 6, 6, 5, 6, 6, 6, 6, 5, respectively). Values are the median ± the 5 and 95 percentile.
