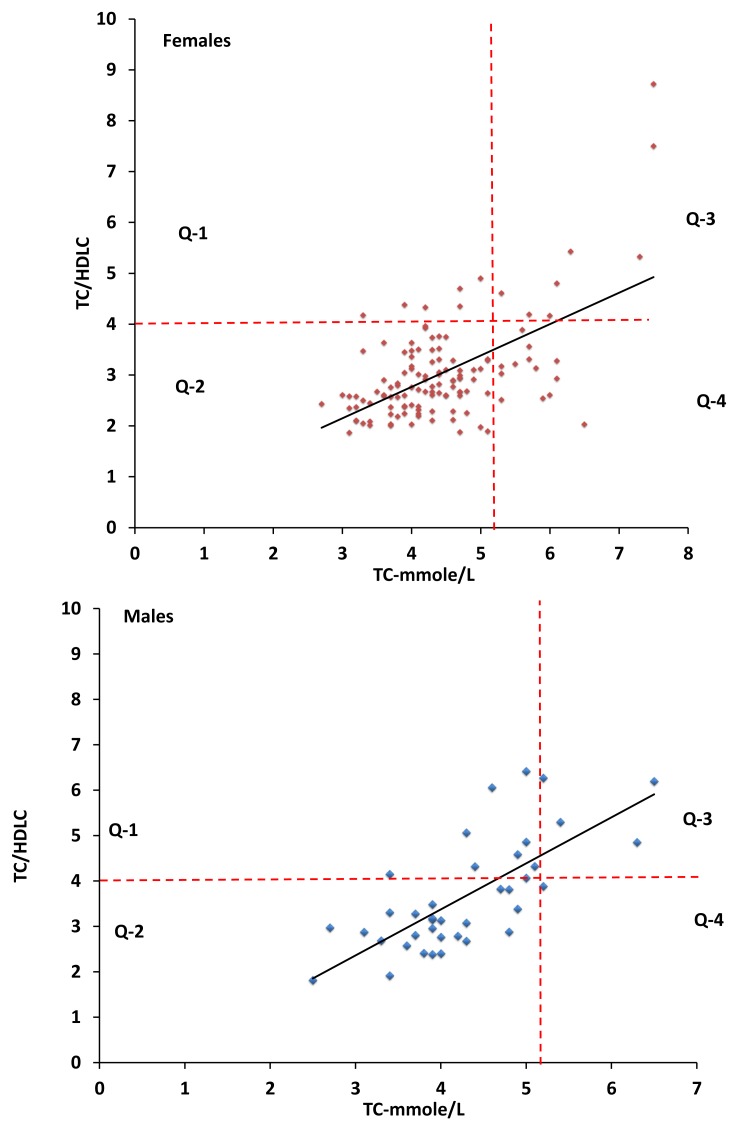
Figure 2.
Positive correlation between high TC and TC/HDLC. 46.2% of the 26 volunteers with high cholesterol (TC) have high ratio of TC/HDLC (Q-3 in both graphs), while only 9.1% could be detected in the volunteers with normal or low cholesterol (Q-1 in both graphs). The cutoff values for TC and TC/HDLC are drawn in dashed lines.

