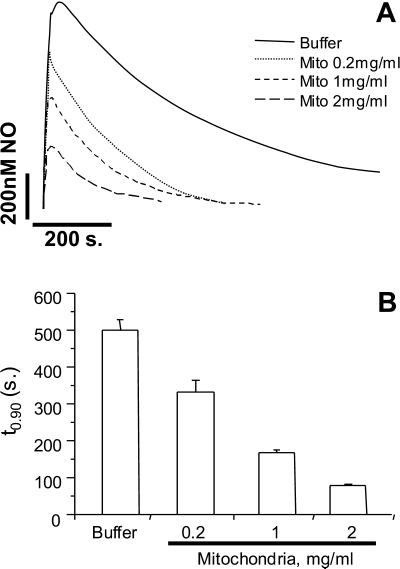
Figure 3.
Dependence of NO Decay on mitochondrial concentration. NO (1 μM) was added to buffer alone, or mitochondria suspended at 0.2, 1, and 2 mg/ml, at 80% O2. (A) Averaged decay profiles for buffer alone (solid line) and mitochondria (dotted and dashed lines). (B) t0.9 values for the curves in A. Data are means ± SEM from at least three independent experiments.

