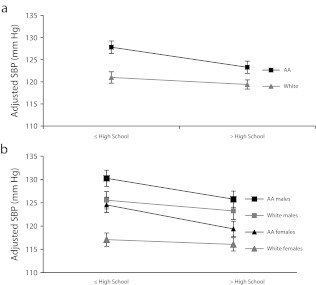
FIGURE 1—
Interaction plots of self-identified race and education: US Family Blood Pressure Program, 1996–2000.
Note. AA = African American; SBP = systolic blood pressure. Interaction plots of education × self-identified race, with education divided into less than or equal to a high-school degree, or greater than a high-school degree (a), and separated by gender (b). SBP measures are adjusted for covariates of age, gender, age × gender, and body mass index (defined as weight in kilograms divided by the square of height in meters).

