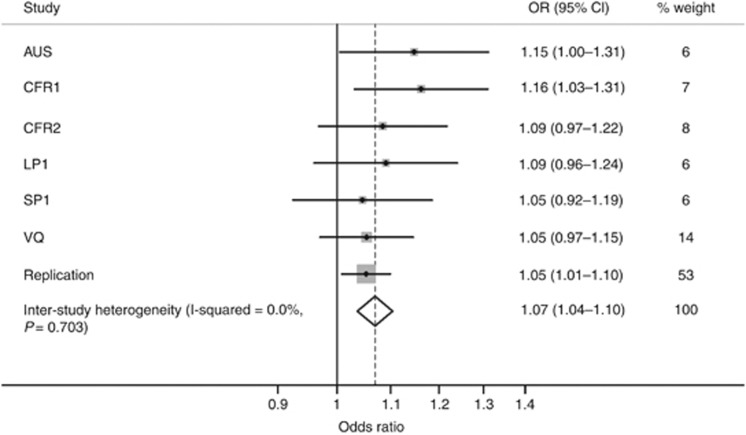
Figure 2.
Forest plot of allelic odds ratio associated with rs2736100 genotype and CRC in the six genome-wide association studies and in the replication series. Horizontal lines represent 95% CIs. Each box represents the allelic OR point estimate, with the area being proportional to the weight of the study. The diamond (and broken line) denotes the overall summary estimate, with CIs given by its width. The unbroken vertical line is at the null value (OR=1.0).

