Figure 4.
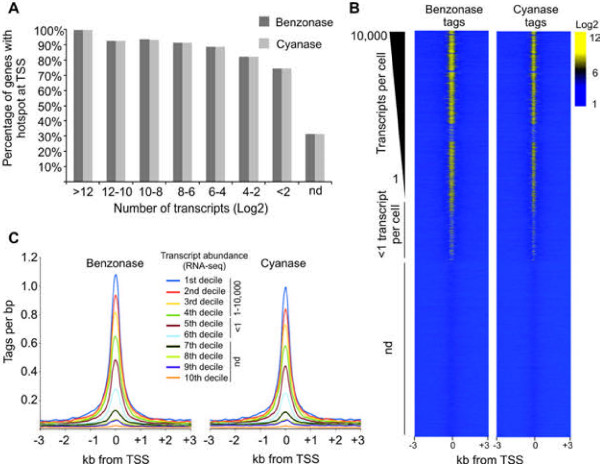
Benzonase accessibility of TSS. The Level of accessibility correlates with levels of gene transcription.(A) Transcripts from annotated genes were divided into eight bins according to mRNA abundance (transcripts pr cell, Log2) based on mouse liver RNA-seq data [18]. Genes producing no detectable transcripts are labeled nd (not detected). All TSSs from individual genes were extracted from the UCSC genome browser and related to Benzonase and Cyanase hotspots. Genes with multiple TSS were scored when at least one of the TSSs overlapped with a nuclease hotspot. (B) Genes were ranked according to transcript abundance and tag densities from Benzonase and Cyanase digestions (all concentrations combined) were measured 3 kb up and downstream of the corresponding TSSs and visualized as heatmaps. (C) Transcripts from annotated genes were divided into deciles according to mRNA abundance (transcripts pr cell), where the first to fourth decile represent genes with more than one transcript pr cell. Deciles five and six contain genes with less than one transcript pr cell and decitile seven to ten contains genes that are not transcribed. Tags sequenced from Benzonase and Cyanase digestions (all concentrations combined) were measured 3 kb up and downstream of the corresponding TSSs and visualized as compiled histograms.

