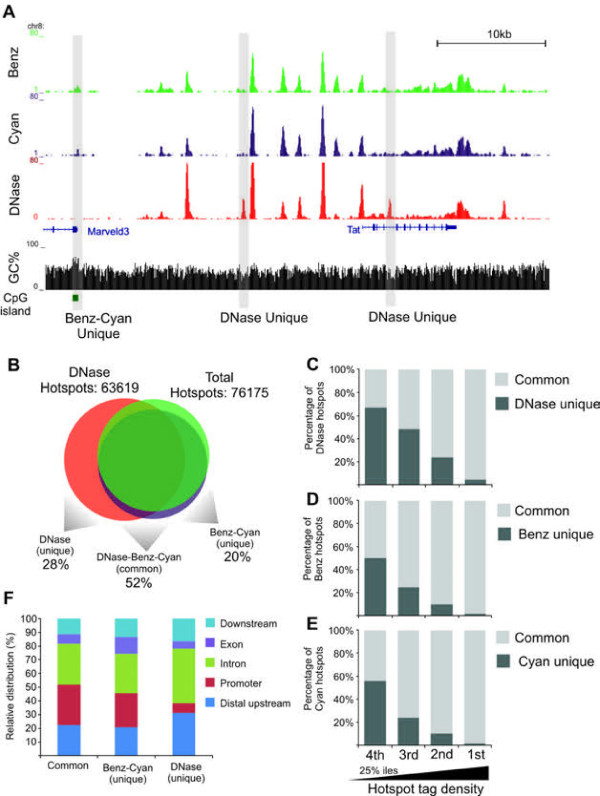
Figure 5.
Direct comparison of hotspots identified by DNase I, Benzonase and Cyanase in the mouse liver genome.(A) Example of aligned sequence tags at a region surrounding the Tat gene. Aligned tags from Benzonase and Cyanase and DNase I are illustrated together with presence of GpC islands (green boxes) and GC percentage in a 10 bp widow. Benzonase-Cyanase and DNase I unique hotspots are indicated. (B) Venn diagram illustrating overlap between regions accessible to DNase I, Benzonase and Cyanase. A total of 63619 hotspots were identified from chromatin digested with DNase I (tags combined from two replicates). Combined with the Benzonase and Cyanase data a total of 76176 nuclease hotspots were identified. 28% of these are unique to DNase I, 52% are identified by DNase I and Benzonase-Cyanase and 20% are unique to Benzonase-Cyanase. (C-E) Hotspots identified by DNase I (C), Benzonase (D) and Cyanase (E) were divided into quartiles according to tag density of hotspots, where the first 25%-ile is the most intense hotspots and the fourth 25%-ile is the least intense hotspots. Hotspots identified by DNase, Benzonase and Cyanase (common) and nuclease unique hotspots were quantified and visualized as percentage of total hotspots identified by DNase I (C), Benzonase (D) and Cyanase (E).

