FIG. 6. .

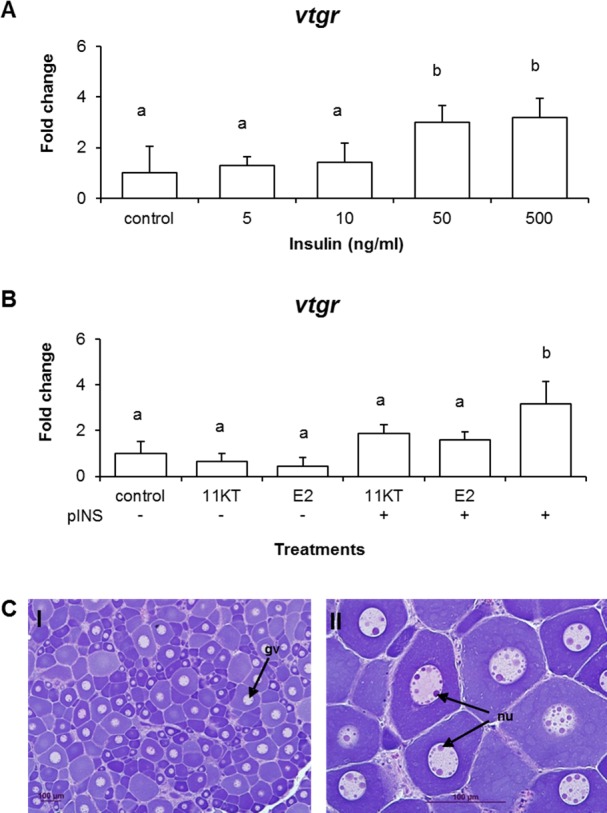
LMB vtgr expression in previtellogenic oocytes after hormonal treatments. A) Dose response effects of pINS on vtgr expression. Data is plotted as mean ± SEM (n = 3). B) Effects of a single hormone or hormone combination treatment on vtgr expression. Open bars represent expression levels detected by real-time PCR. Data is plotted as mean ± SEM (n = 4). C) Histology sections stained with H&E showing LMB previtellogenic oocytes from ex vivo exposure. I) Oocytes are mostly in perinucleolar stage (PN). II) Section showing nucleoli (nu) around the inner germinal vesicle membrane of the germinal vesicle (gv). Significant differences (P < 0.05) among treatments are represented by letters. Treatments: 11-KT (500 μM), E2 (500 μM), pINS (500 ng/ml), pINS (500 ng/ml) + 11KT (500 μM), pINS (500 ng/ml) + E2 (500 μM). Bars = 100 μm.
