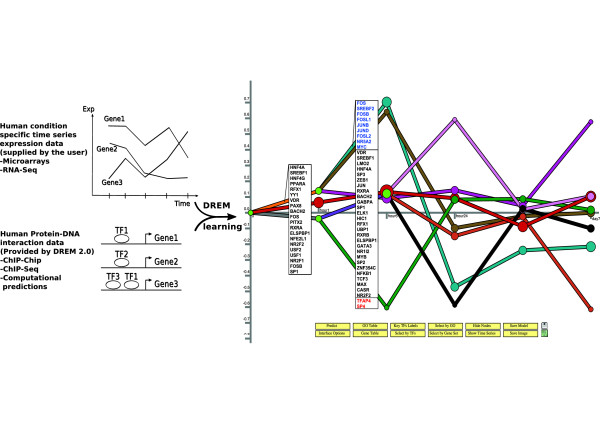
Figure 3 .
Analysis of asbestos time series data set. DREM 2.0 analysis of expression data from human A549 lung cells treated with asbestos using predicted protein-DNA interactions. (left) Input data supplied to DREM 2.0. (right) The model learned for the 5 time points. TFs (IDs in boxes) are predicted to regulate genes diverging at green split nodes. TFs in blue and red are up- and down-regulated, respectively.

