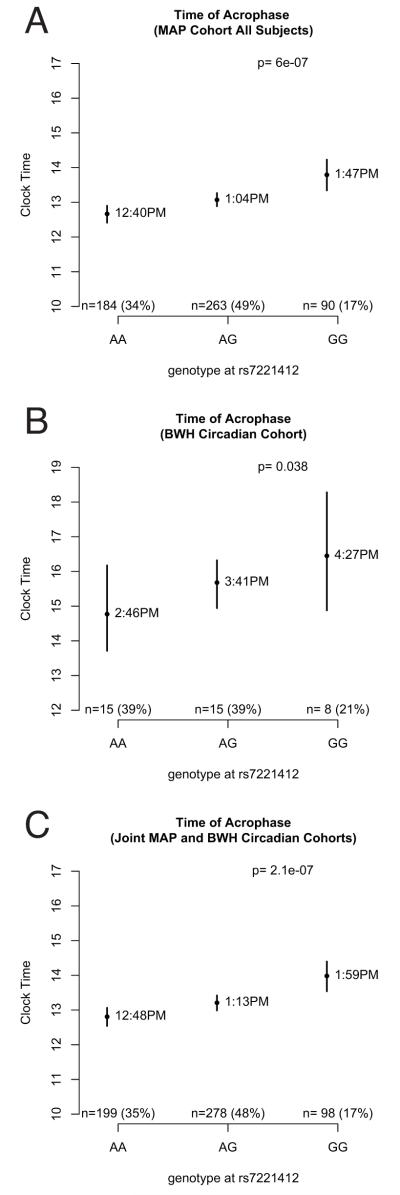
Fig 2. Association between the average timing of the acrophase of activity and genotype at rs7221412.
Dots indicate angular means, and bars indicate 95% confidence intervals of the mean. All significance values calculated using Fisher-Lee regression using an additive model, and adjusted for age, sex, and presence or absence of dementia. In the joint analysis, source cohort was added as an additional covariate. A: MAP cohort. B: BWH Circadian Cohort. C: Joint Analysis.

