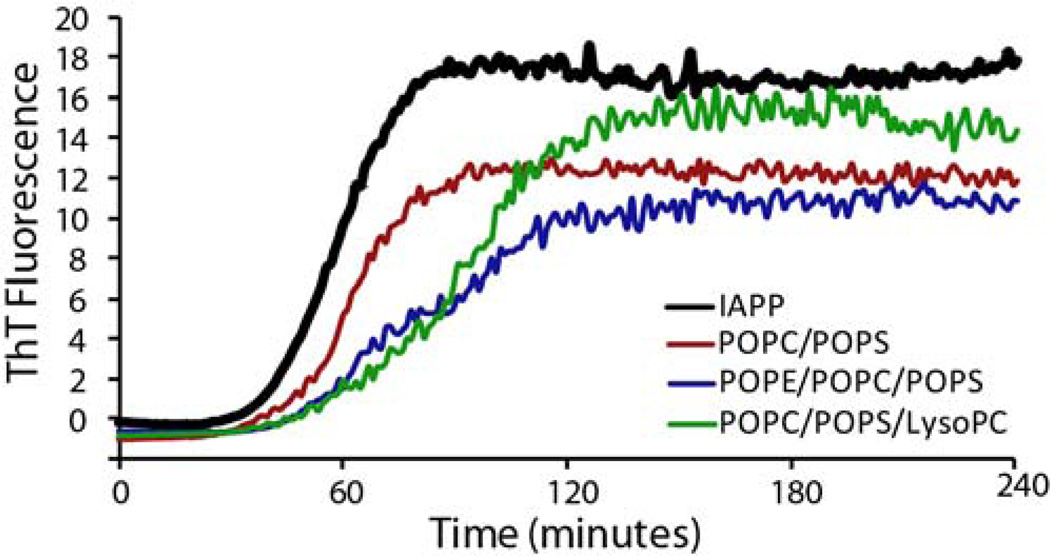
Figure 3.
IAPP fiber formation kinetics measured by ThT fluorescence. Fiber formation was measured in the presence of 250 µM of POPC/POPS (7:3 molar ratio), POPE/POPC/POPS (3/4/3), POPC/POPS/LysoPC (6.8/3/0.2) vesicles. Fiber formation in the absence of lipids is indicated by the black line. IAPP concentration was 2.5 µM for all samples. Experiments were performed at 25 °C in 10 mM phosphate buffer, 100 mM NaCl, pH 7.4. Results are the average of three experiments.

