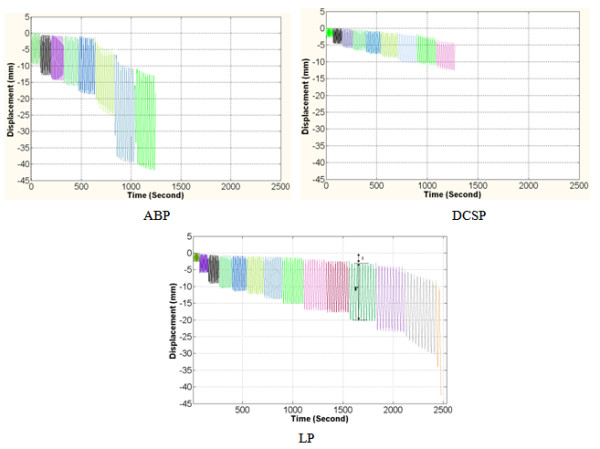
Figure 8.

Typical time versus displacement curves obtained from the femur constructs with implants ABP, DCSP and LP under the cyclical axial loading. The color coding represents the steps of the incremental cyclic loading. Letters (i) and (r) represent irreversible (plastic) and reversible deformation, respectively.
