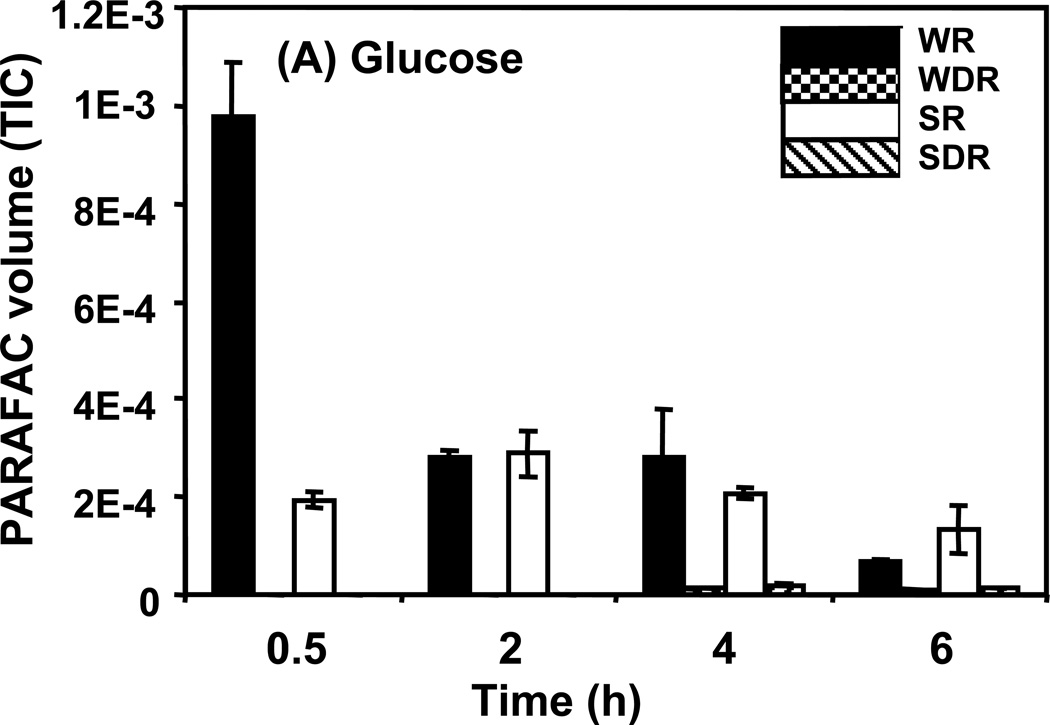
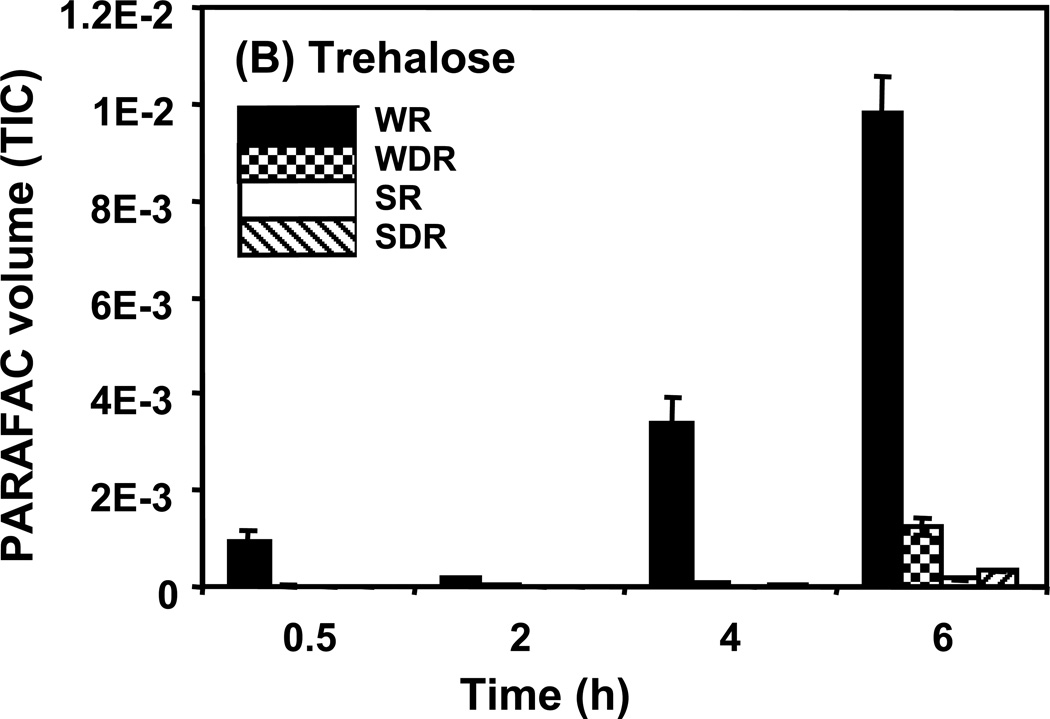
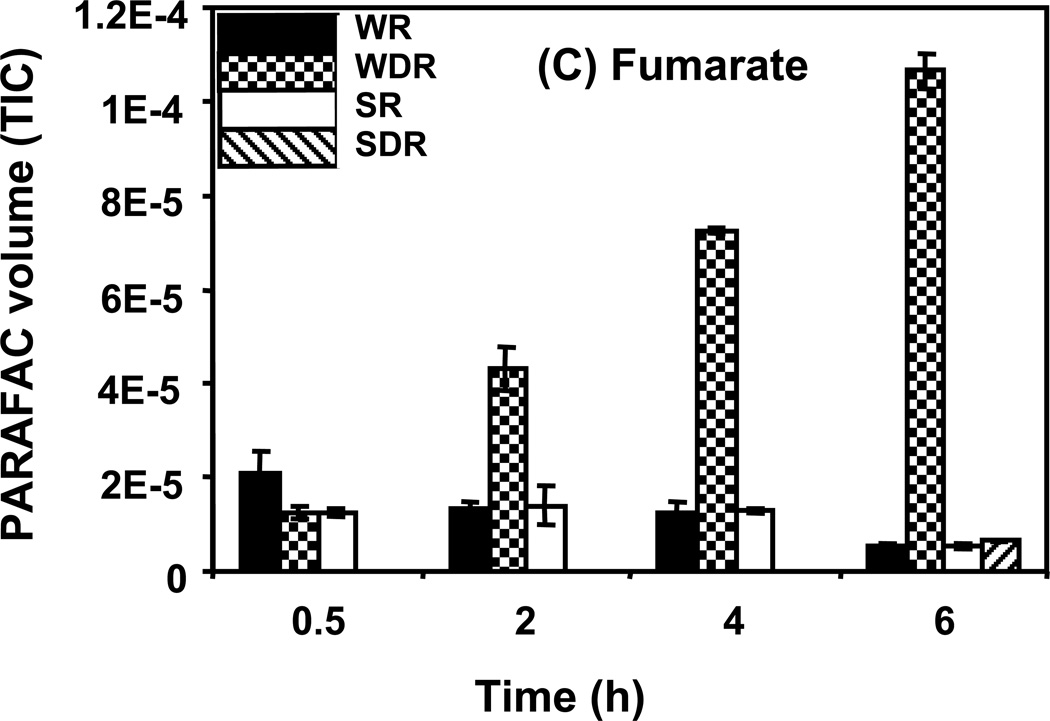
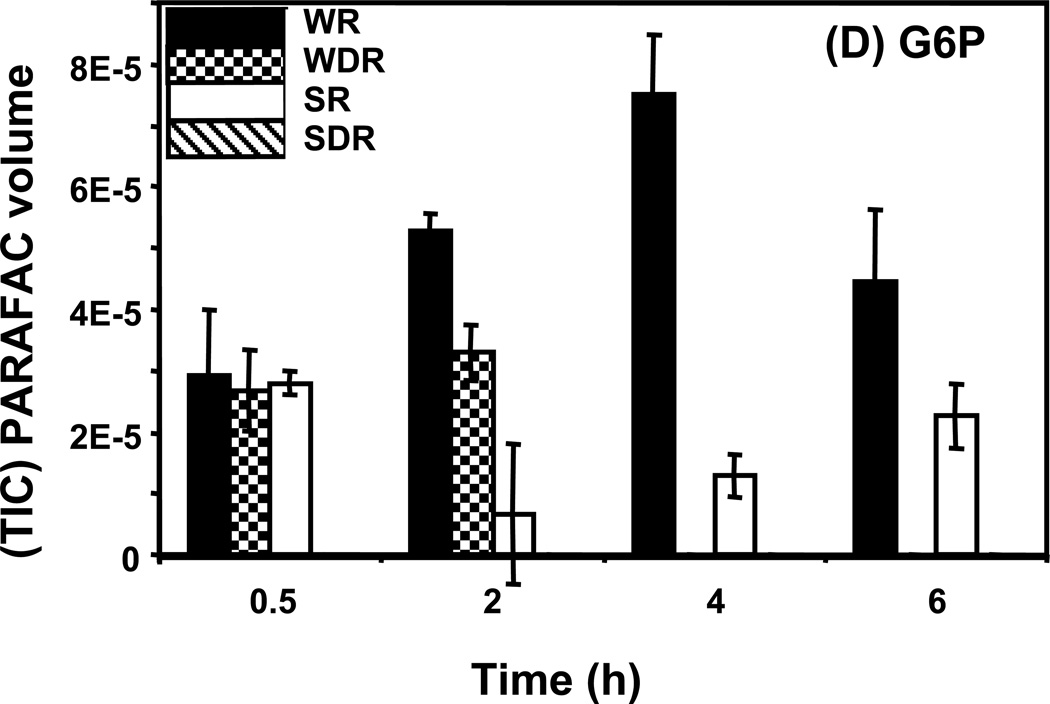
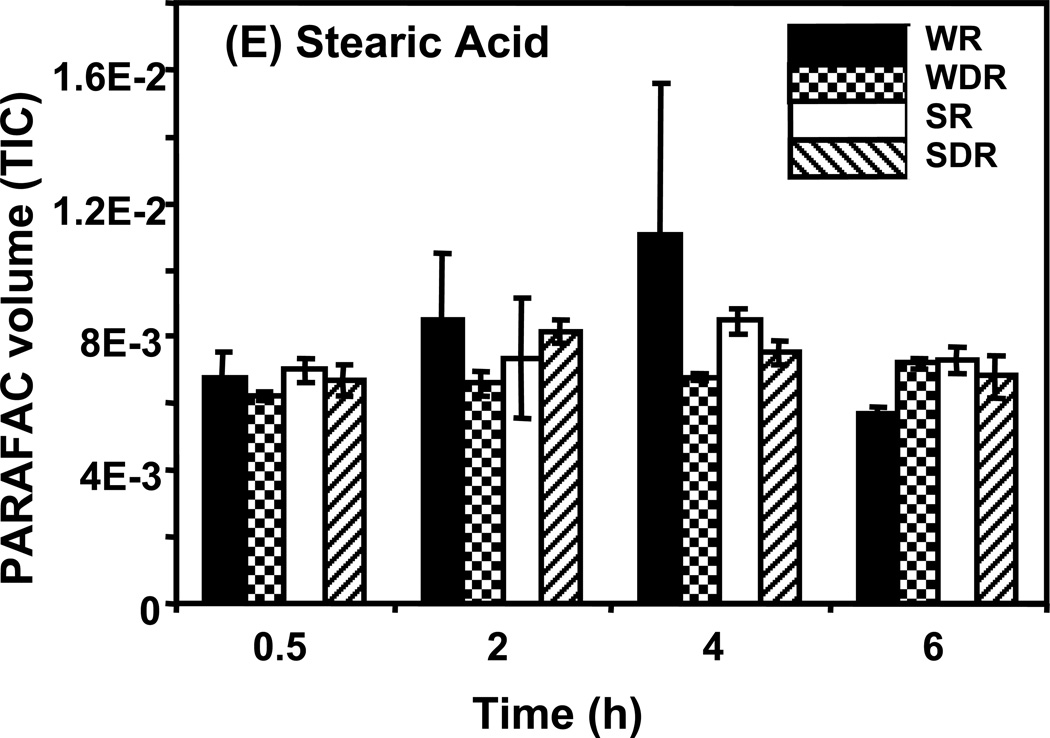
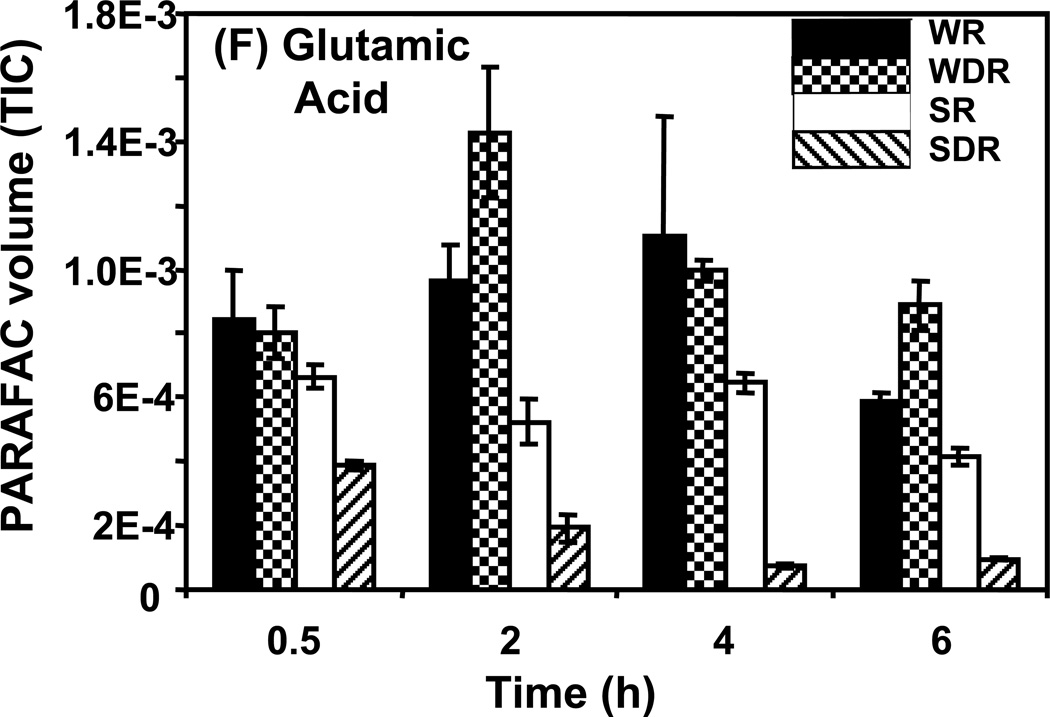
Figure 5.
Time course data for selected metabolites is presented, normalized to TIC only. (A) Glucose is shown elevated in both wild type and mutant in R conditions. (B) Trehalose is a major carbohydrate storage molecule. The relative concentrations increased over time in the WR cells. This result was confirmed in three additional biological replicates. Additionally, a tps1Δ strain was analyzed and the absence of this peak was observed. (C) Fumarate is a member of the TCA cycle. The relative peak volumes increase steadily in WDR, but remain low in the other classes. (D) Glucose-6-phosphate (G6P) is a member of glycolysis. The WR peak profile is elevated compared to all other classes. (E) Stearic Acid remains essentially constant between classes and time points. (F) Glutamic acid is an amino acid. Wild-type is elevated over the mutant for both R and DR.

