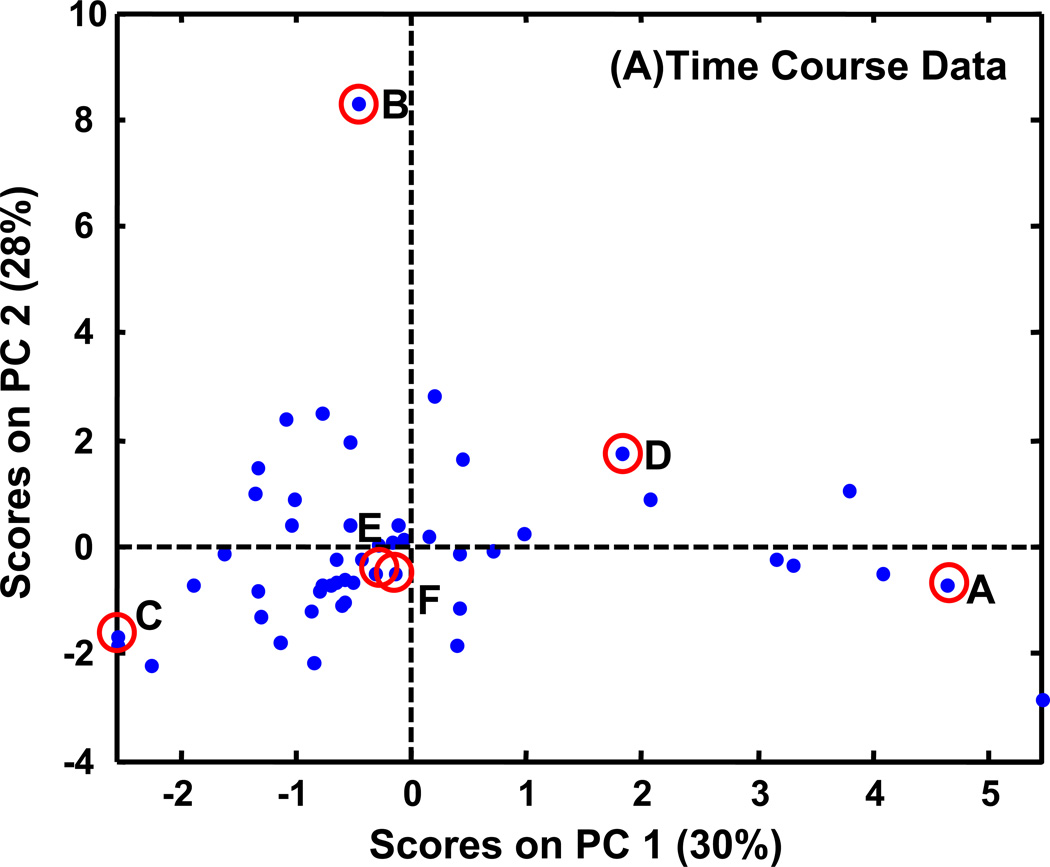
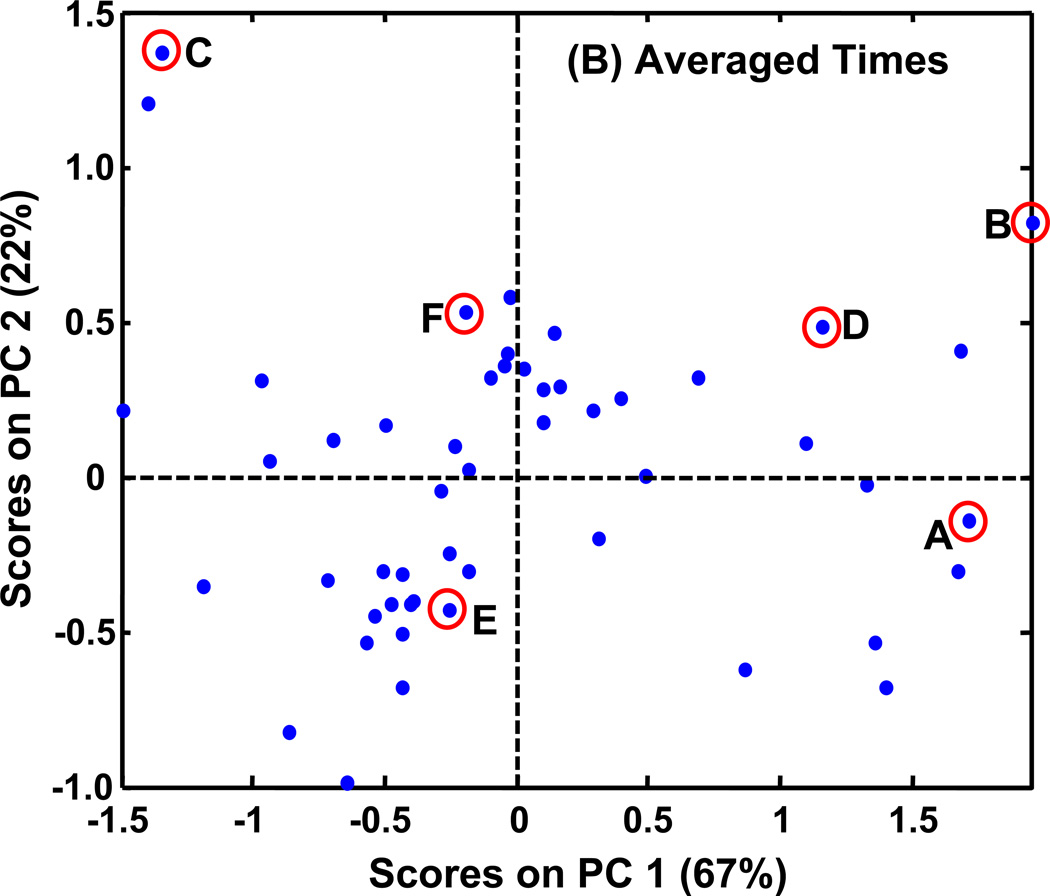
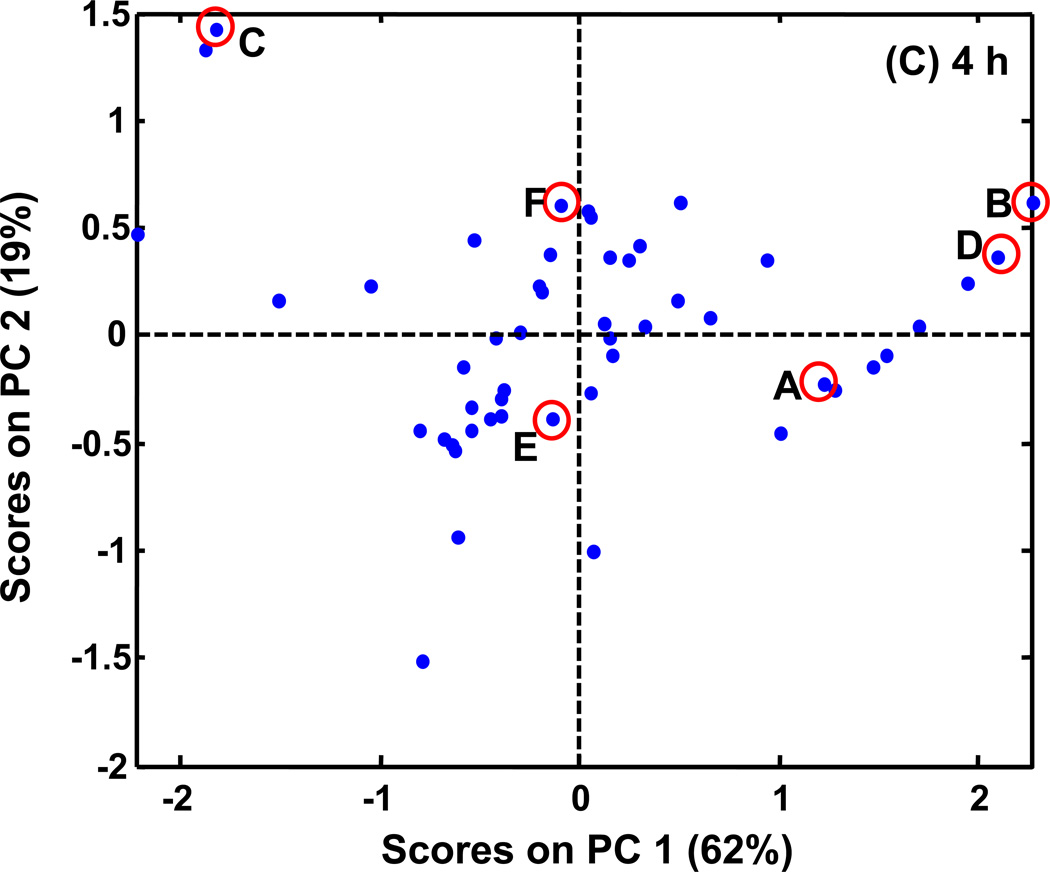
Figure 7.
PCA scores plots of PARAFAC signal volume patterns for each metabolite, normalized as explained in the text. The same six metabolites shown in Figures 5 (and 6) are indicated on these plots with letters corresponding to Figures 5 (and 6). (A) PCA results with time course information when only injection replicates are averaged. There are 16 classes (WR, WDR, SR, SDR) × (0.5, 2, 4, 6 h). (B) PCA results when all injections, and time points are averaged for a given growth condition and yeast strain. There are four classes (WR, WDR, SR, SDR). (C) PCA results for a single time, 4 h. There are four classes (WR, WDR, SR, SDR).


