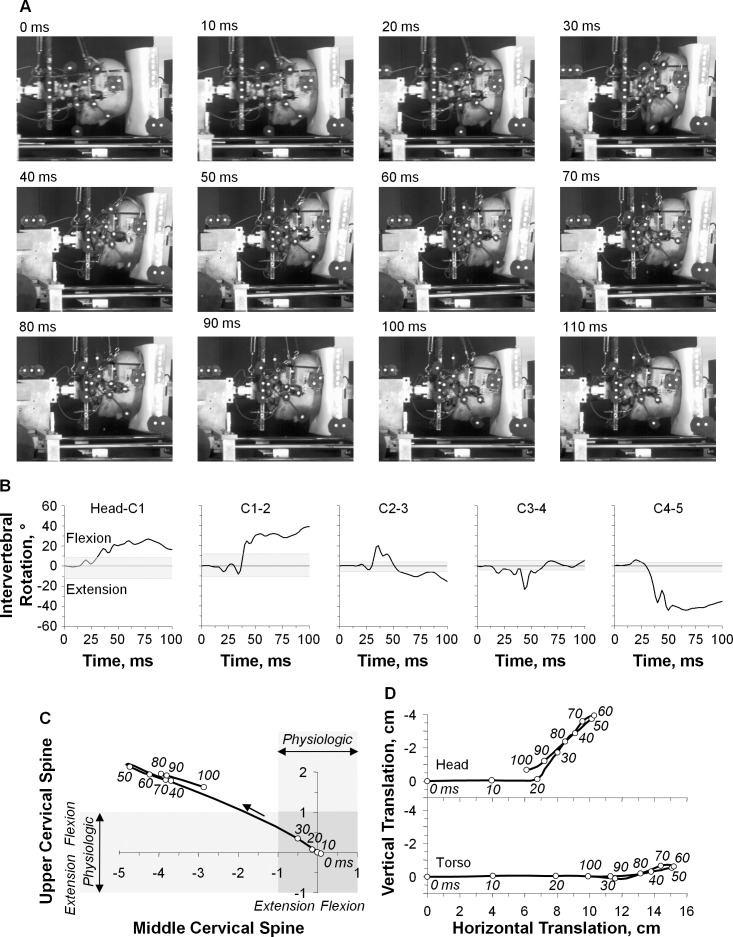
Figure 2.
A representative example of head-first impact (specimen 2, peak barrier impact force = 6154.1 N). A, High-speed camera images are shown at time = 0 through 110 milliseconds in 10-millisecond increments. B, Time-history responses for intervertebral rotations. The physiologic rotation range, as determined from intact flexibility testing, is indicated by grey horizontal shading for each spinal level. C, Normalized upper and middle cervical spine rotation. The S-shape neck curvature is represented as the top left quadrant. The physiologic rotation bands for upper and middle cervical spine rotation are indicated with lightly shaded horizontal and vertical rectangles, respectively. Their intersection (darkly shaded) forms the physiologic region representing the safe curvature zone. The time course is indicated in 10-millisecond intervals. D, Head and torso translations in the global coordinate system with the time course are indicated in 10-millisecond intervals.

