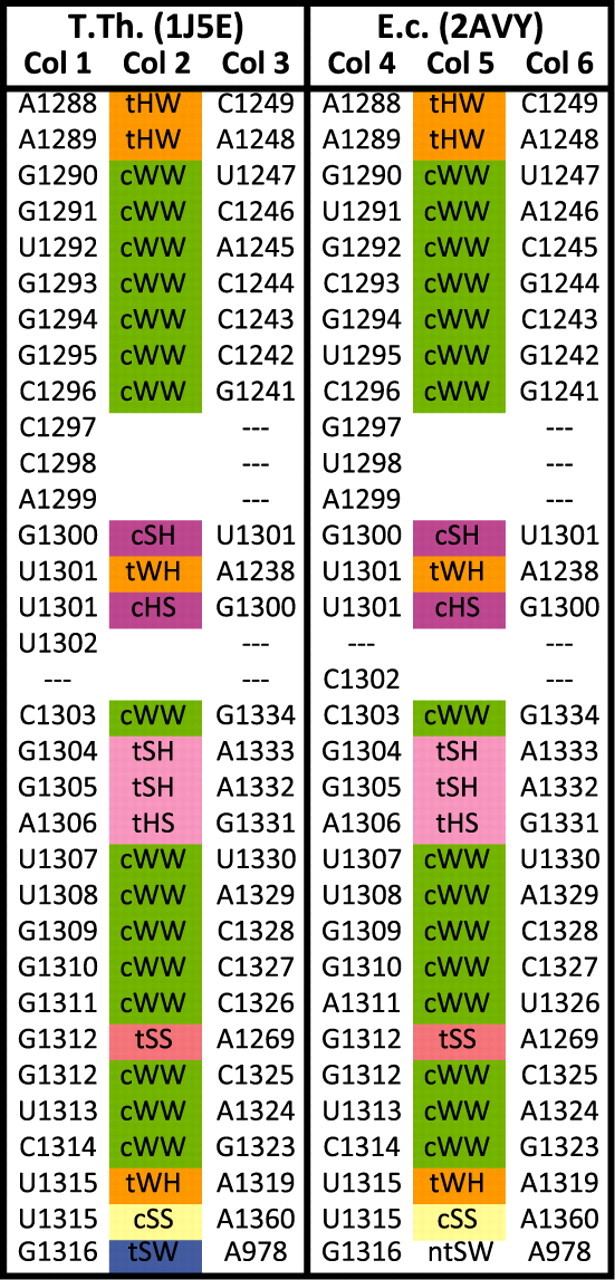
Fig. 2.

A portion of the R3D Align alignment of T.th. and E.c 16S rRNA. The spreadsheet simultaneously displays aligned nucleotides and base-pairing interactions. Nucleotides in Columns 1 and 4 of the same row are aligned, as are the nucleotides in Columns 3 and 6. The kind of base-pairing interaction between the nucleotides of Columns 1 and 3 (if any) is indicated in Column 2. Column 5 indicates the base-pairing interaction between the nucleotides in Columns 4 and 6. Base pairs are annotated by FR3D using the Leontis/Westhof system. All corresponding base pair types are identical except the last row shows a near tSW base pair in E.coli Note that nucleotides U1302 in T.th. and C1302 in E.coli are not aligned to one another. This portion of the alignment indicates strong conservation between the two structures as well as proper alignment.
