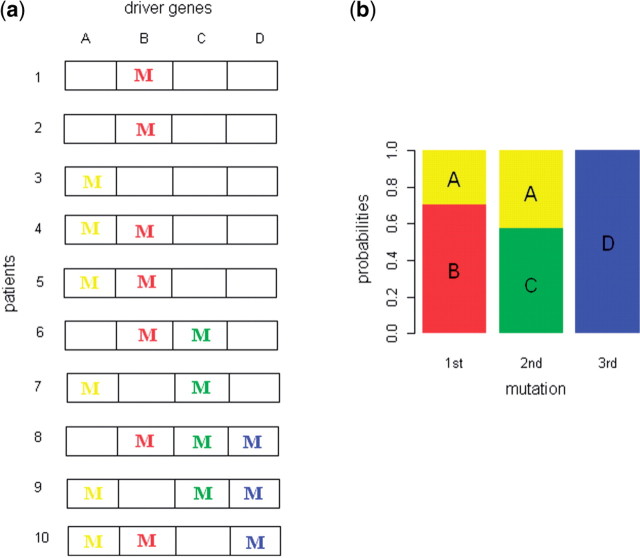
Fig. 1.
Distribution of mutations in driver genes and estimates of their order (a) Distribution of mutations in four driver genes for ten patients of the same tumor type. For each patient, the colored letter ‘M’ represents a mutation for the corresponding gene. (b) Estimates for Pk,i, the probability that the k-th mutational event involving the four driver genes occurs in gene i. The length of the sub-bar corresponding to gene i at the k-th mutational event is the estimates for Pk,i

