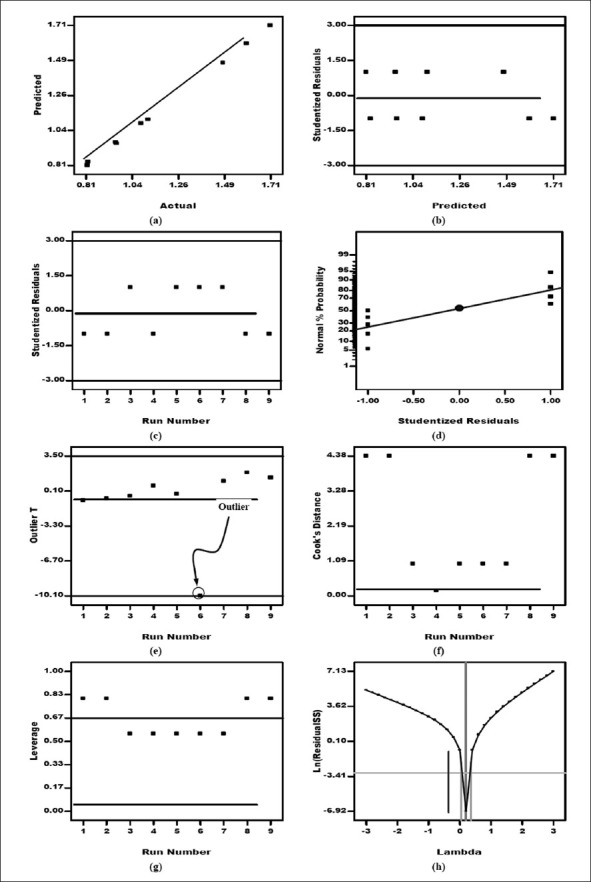
Figure 4.

Model diagnostic plots to investigate the goodness of the fit of the proposed model(s). (a) Predicted versus actual; (b) studentized residuals versus predicted; (c) studentized residuals versus run; (d) normal probability plots; (e) outlier T plot; (f) Cook's distance plot; (g) leverage plot; (h) Box–Cox plot (figure adopted from ref.[1])
