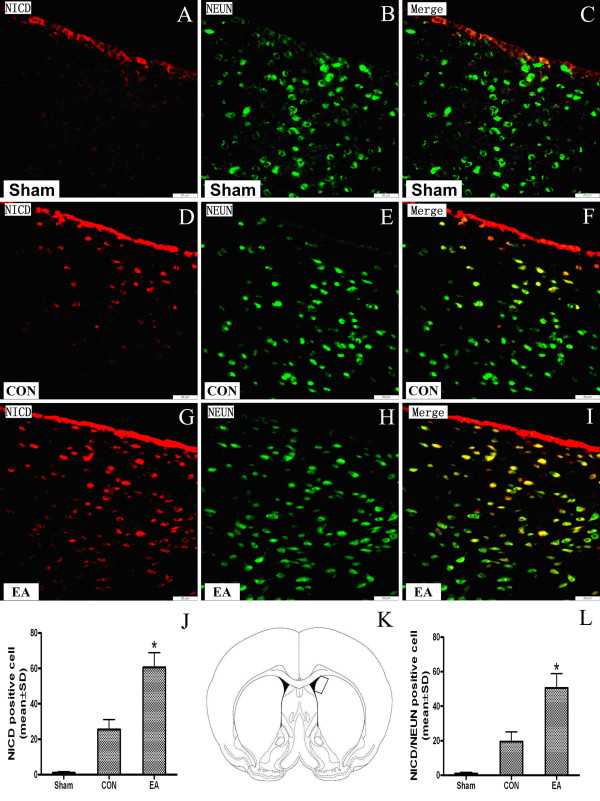
Figure 3.
Up-regulation of neuronal Notch1 NICD in the rat brain at 24 h after EA pretreatment. (A–I) Representative double immunofluorescence staining of Notch1 NICD cells (red) and the neuronal marker (green) NeuN (neurons) in brain sections were displayed. The Notch1 NICD immunoreactivities are increased and colocalized with the neuronal immunoreactivities 24 h after EA pretreatment. Scale bars = 20 μm. Figures J and L show quantitative data of NICD- positive and NICD/NEUN double-positive cell numbers every field in the ipsilateral striatum (n = 3) . The rectangle in K (bregma, 0.2 mm) shows the precise region of the rat brain where these images were taken. (*P < 0.05 EA vs. CON).

