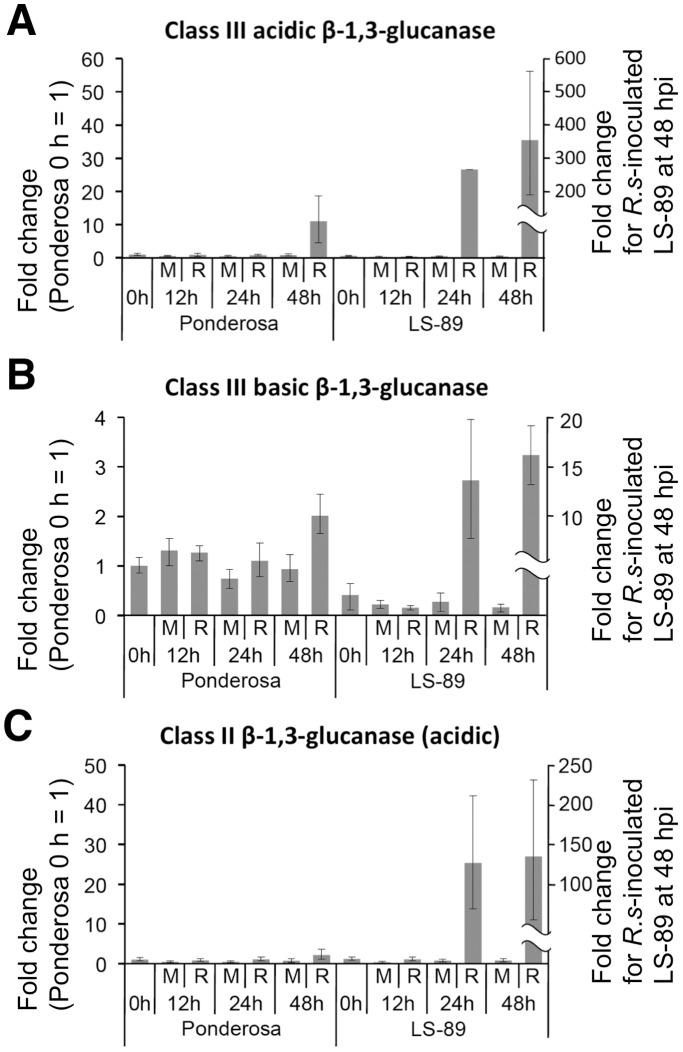
Figure 3. Real-time quantitative RT-PCR analysis of time course of relative transcription levels of β-1,3-glucanase genes in LS-89 and Ponderosa after inoculation with Ralstonia solanacearum or water (mock).
Total RNA was extracted from stems to analyze expression of acidic class III (A), basic class III (B) and class II (C) β-1,3-glucanase genes at 0, 12, 24 and 48 hpi. Sample from Ponderosa at 0 hpi was used for calibration.

