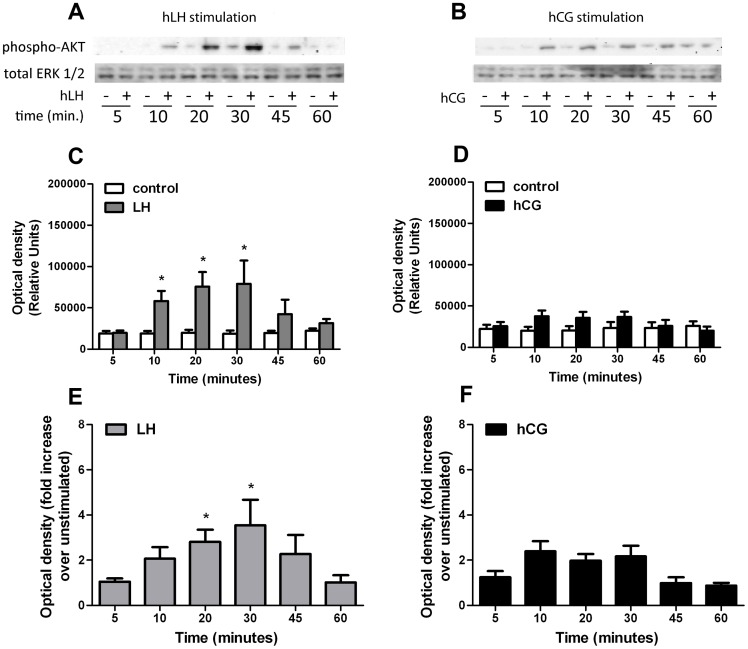
Figure 7. Time-course analysis of the phospho-AKT activation in hGLC under 100 pM hLH or 100 pM hCG stimulation.
a. Comparison of phospho-AKT activation in hLH-stimulated vs unstimulated (control) at different time-points, by Western blotting (image is representative of 4 independent experiments; total ERK as normalizer). b. Comparison of phospho-AKT activation in hCG-stimulated vs unstimulated (control) at different time-points, by Western blotting (image is representative of 4 independent experiments; total ERK as normalizer). c, d. Relative semi-quantification of the optical density representing phospho-AKT activation (shown in figs. 7A,B) stimulated by (C) hLH or (D) hCG, compared to unstimulated (Mean±SEM; n = 4; * = significant vs unstimulated; t-test; p<0.05). e. Normalization of the phospho-AKT signals measured in hLH-stimulated samples (represented as relative units in Fig. 7C) over each unstimulated (Mean±SEM; n = 4; * = significant vs unstimulated; two-way analysis of variance; p<0.05). f. Normalization of the phospho-AKT signals measured in hCG-stimulated samples (represented as relative units in Fig. 7D) over each unstimulated (Mean±SEM; n = 4; * = significant vs unstimulated; two-way analysis of variance; p<0.05).

