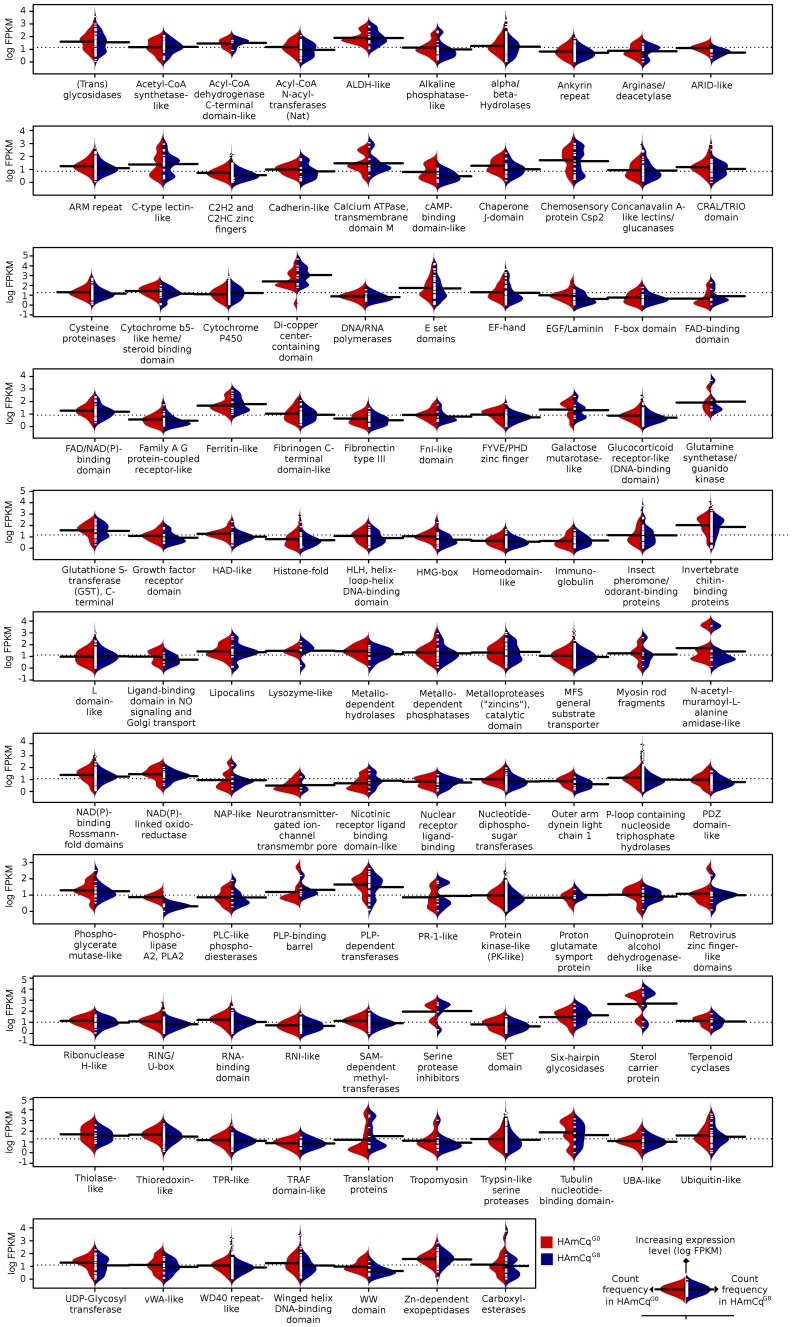
Figure 2. Log normal bean-plots for all expressed genes within SCOP superfamilies (SCOP version 1.75; supfam.cs.bris.ac.uk/SUPERFAMILY/index.html) in HAmCqG0 and HAmCqG8.
The distribution along the Y axis indicates a higher level of gene expression, while the distribution along the X axis indicates the proportion of genes expressed at the given level of gene expression along the Y axis. Distributions are oriented along a common central baseline so that distributions in red (HAmCqG0) have more genes expressed at a given gene expression level (log FPKM) if the distribution is further to the left on the X axis, while distributions in blue (HAmCqG8) are higher if they are further to the right of the X axis. The central vertical baseline for each superfamily is a mirror point for the two distributions.

