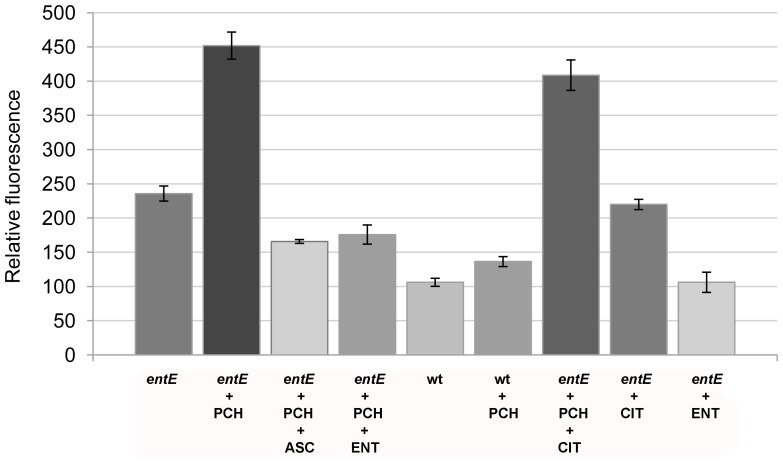
Figure 2. Levels of reactive oxygen species in E. coli wild type and entE mutant.
Quantitation of ROS levels using the DCFA-DA probe. Fluorescence intensities are relative to that of the control. Control: wt grown in 2 mL M9 medium; PCH indicates cells grown in the presence of 15 µM pyochelin; ASC indicates supplementation with 1 mM ascorbic acid; ENT designates addition of 1 µM of pure enterobactin; CIT indicates supplementation with 50 µM citrate. Error bars = SEM, n = 3.

