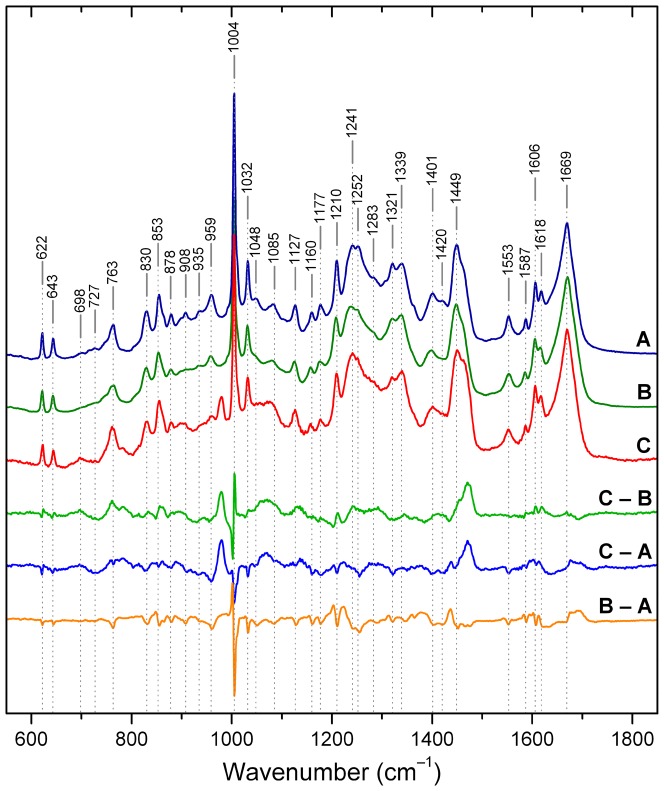
Figure 3. Raman spectra of spinach PsbP.
Spectra acquired on samples of protein in solution (A), DCDR glassy deposit (B), and crystal (C). Difference spectra are depicted below the figure: DCDR minus solution (B – A); crystal minus solution (C – A); crystal minus DCDR (C – B). The frequencies indicated by vertical dashed lines mark band positions in solution. Band assignments are presented in Table 2.

