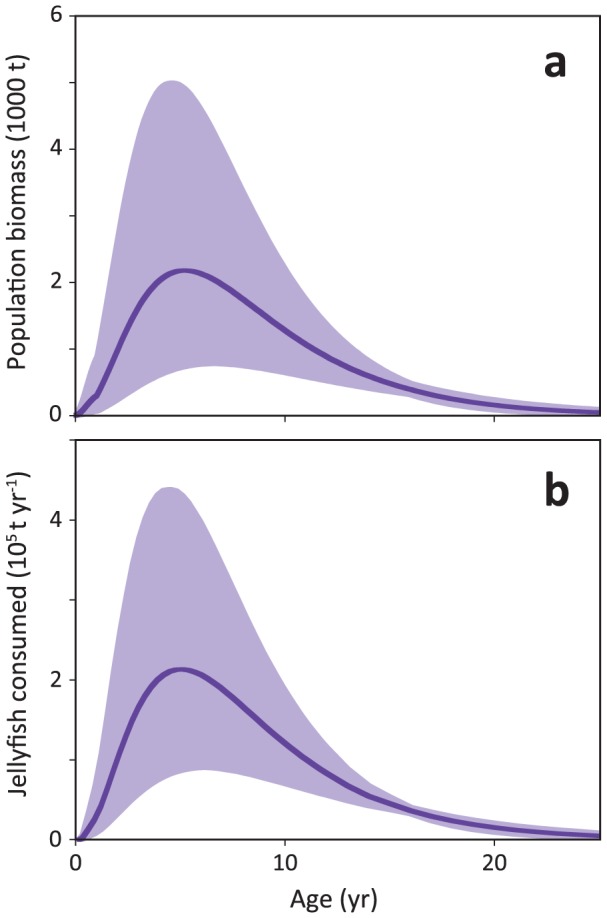
Figure 4. Total Pacific leatherback population biomass (a) determined by multiplying mortality with the VBGF for mass; and consumption rates in metric tonnes of jellyfish per year for the entire Pacific leatherback population (b) determined by multiplying mortality with food consumption rate.

Solid dark purple line on plots a and b is the model average, purple shaded area is the 95% CI, obtained from Monte Carlo simulations of the input variables.
