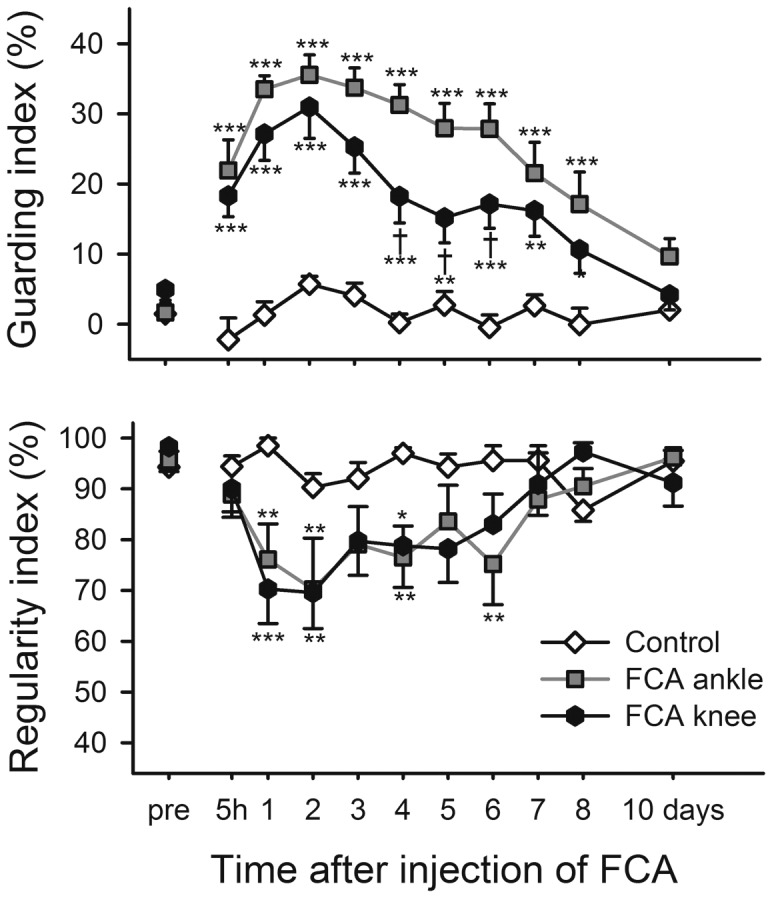
Figure 8. Injection site of FCA plays a role for magnitude of response during locomotion.

Time course of the guarding index (upper panel) and regularity index (lower panel) for control rats and rats injected with FCA into the ankle or knee joint. Bonferroni's test subsequent to ANOVA: * = p<0.05, ** = p<0.01, *** = p<0.001 compared to the control group at the same time point and † = p<0.05 when comparing ankle to knee injection groups. Data shown as mean and SEM, n = 10 per group.
