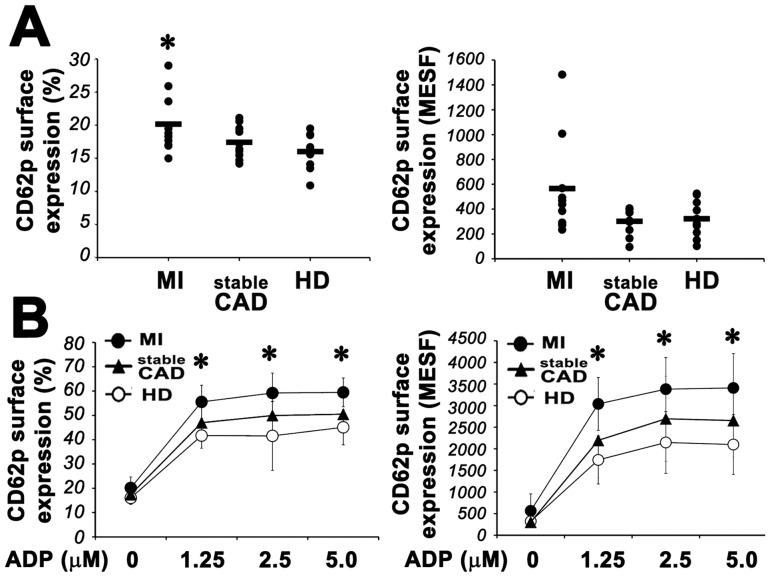
Figure 1. Platelet activation in MI patients.
Panel A: Left. Flow cytometric analysis of platelet CD62p surface expression in patients with MI, sCAD and healthy donors. Cells were stained with specific mAb anti P-selectin, as described in Materials and Methods. Ten patients were analyzed for each group. Right. Quantification of CD62p expression on the surface of platelets from MI, sCAD and HD. Absolute numbers of surface antigens expressed/cell (MESF). (Anova and Bonferroni t-test; * P<0.05 MI vs HD; no significant differences were found between stableCAD and HD). Panel B: Platelet surface expression of CD62p in MI (•), sCAD (▴) and HD (○) patients in the presence of increasing doses of ADP. Left panel shows the percentage of positive cells. Right panel shows the absolute numbers of surface antigens expressed/cell (MESF). Data from 7 patients of each group are expressed as means ± S.D. (Anova and Bonferroni t-test; * P<0.05 MI vs HD; no significant differences were found between stable CAD and HD).

