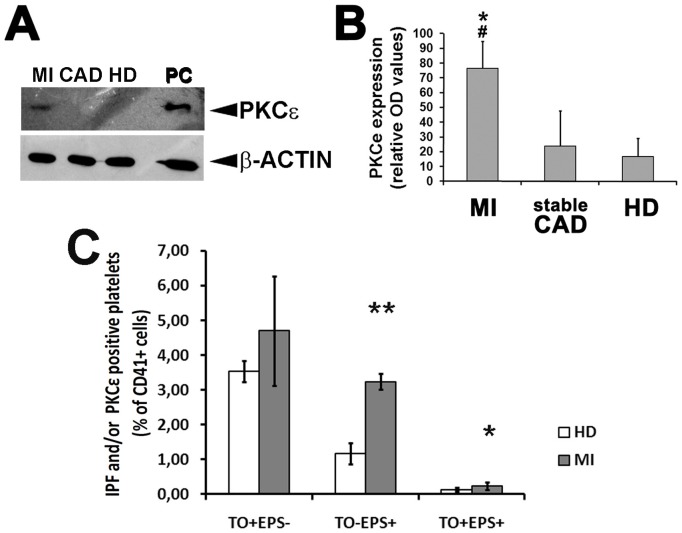
Figure 3. Platelets from MI patients express PKCε protein.
Panel A: A representative Western blot assay for the detection of total PKCε protein expression in platelets from PKCε mRNA-positive MI, sCAD and HD. β-Actin was assayed for protein loading. Panel B: Densitometric analysis of PKCε protein expression normalized against β-actin in PKCε mRNA-positive MI, sCAD and HD platelets. Data are expressed as means ± S.D. (Anova and Bonferroni t-test; * P<0.05 MI vs HD; # P<0.05 MI vs sCAD; no significant differences were found between sCAD and HD). Panel C: PKCε protein expression in mature and immature platelets from healty donors (HD) and MI patients. Cells were simultaneously labelled with Thyazole Orange (TO) -to visualize the immature platelet fraction (IPF) - and anti-PKCε mAb, and analyzed by flow cytometry. Three populations were identified within the CD41+ cell subset: PKCε negative reticulated platelets (TO+EPS−); PKCε positive reticulated platelets (TO+EPS+); PKCε positive mature platelets (TO−EPS+); (Data from 3 patients/group, expressed as means ± S.D. t-Test ** P<0.001; * P<0.05).

