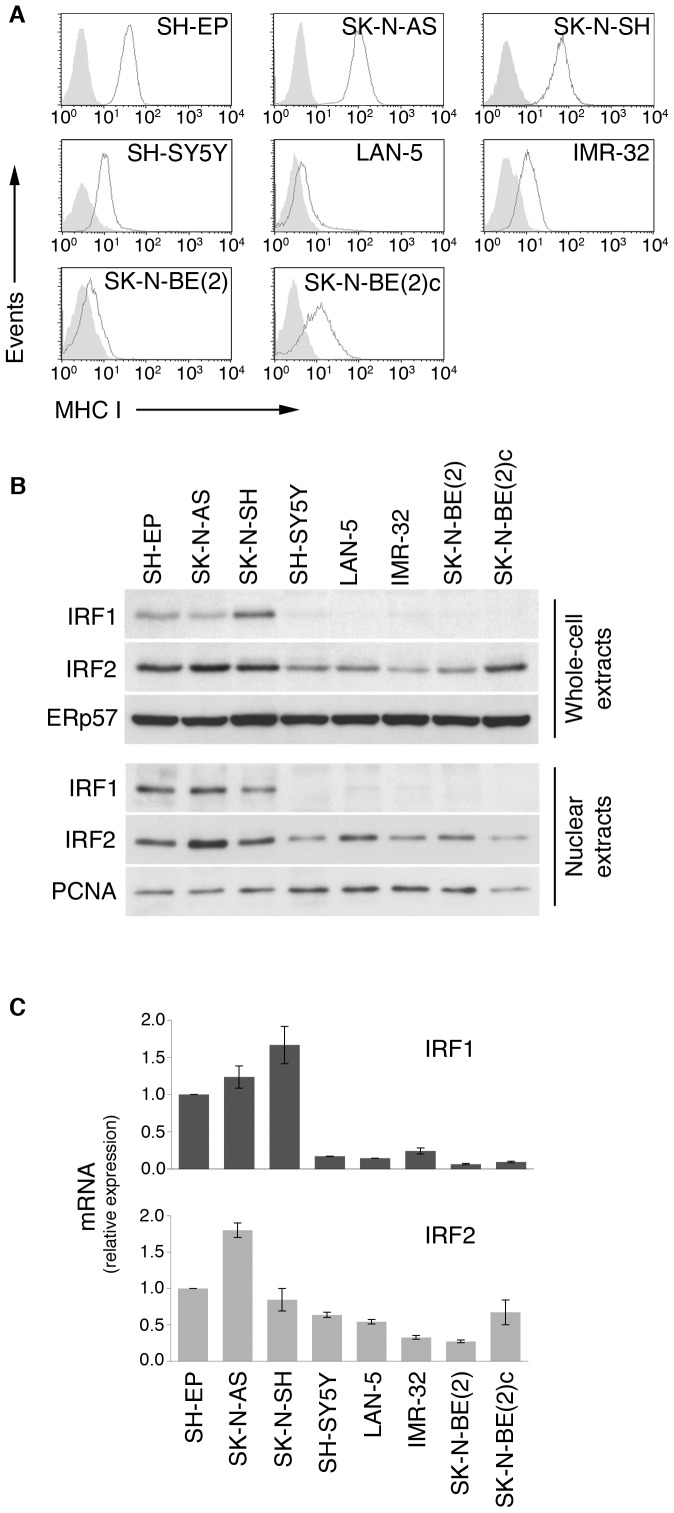
Figure 1. Expression of MHC-I, IRF1 and IRF2 in NB cell lines.
A, flow cytometry analysis of surface MHC-I expression in NB cell lines using W6/32 mAb (grey lines). Shaded histograms, negative controls stained with isotype-matched primary antibody. B, immunoblot analysis of IRF1 and IRF2 in NB cell lines. Equal amounts of whole-cell extracts and nuclear extracts, as indicated, were resolved by SDS-PAGE, immunoblotted and probed with specific antibodies. ERp57 and PCNA were used for normalization. Positive and negative IRF1 and IRF2 controls, as well as densitometric and statistical analysis of WB bands are shown in Fig. S1. C, qRT-PCR analysis of mRNAs from different NB cell lines. 18S RNA was used for normalization. Significant differences between the 3 MHC-I-expressing NB cells and the 5 MHC-I-low NB cells of mRNA expression separately averaged were evaluated as described in Materials and Methods. IRF1: P<0,001; IRF2: P = 0,09; ± SD of triplicate assays. Data shown in the panels A to C are representative of at least 3 independent experiments.

