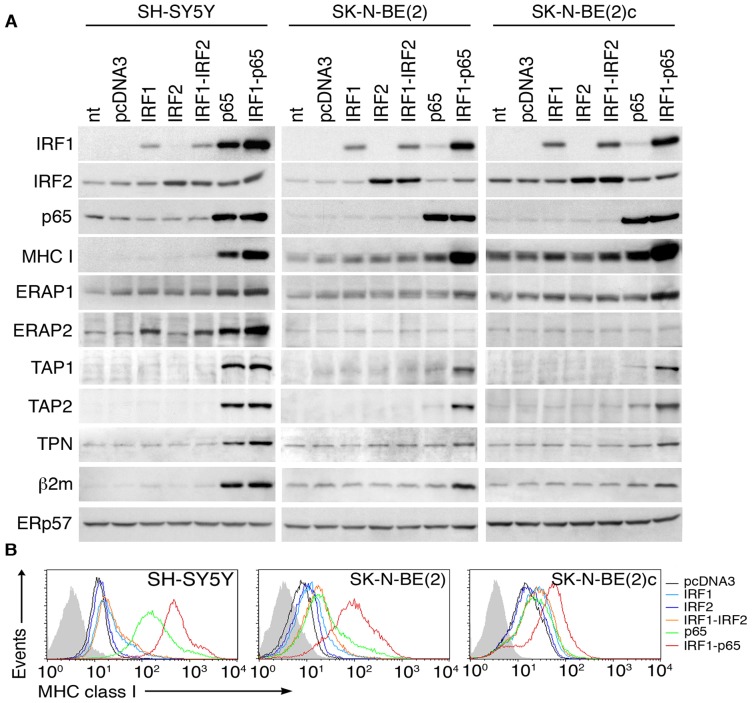
Figure 4. IRF1 and p65 synergistically enhance MHC-I and APM components in NB cell lines.
A, immunoblotting of cell extracts from three NB cell lines left untransfected (none) or single- and double-transfected, as indicated, with the control empty vector (pcDNA3) or vectors expressing IRF1, IRF2, and NF-kB p65. ERp57 was used as loading control. Densitometric and statistical analysis of WB bands related to the cells transfected with pcDNA3, or p65, or IRF1 and p65 are shown in Fig. S5. B, flow cytometry analysis of surface MHC-I expression in the same NB cell lines (indicated by different colors) with mAb W6/32. Isotype-matched negative controls are displayed as shaded histograms. Data shown in panels A and B are representative of 5 and 8 independent experiments, respectively.

