
Figure 5. Double IRF1/p65 transfection renders NB cells susceptible to killing by specific cytotoxic T cells.
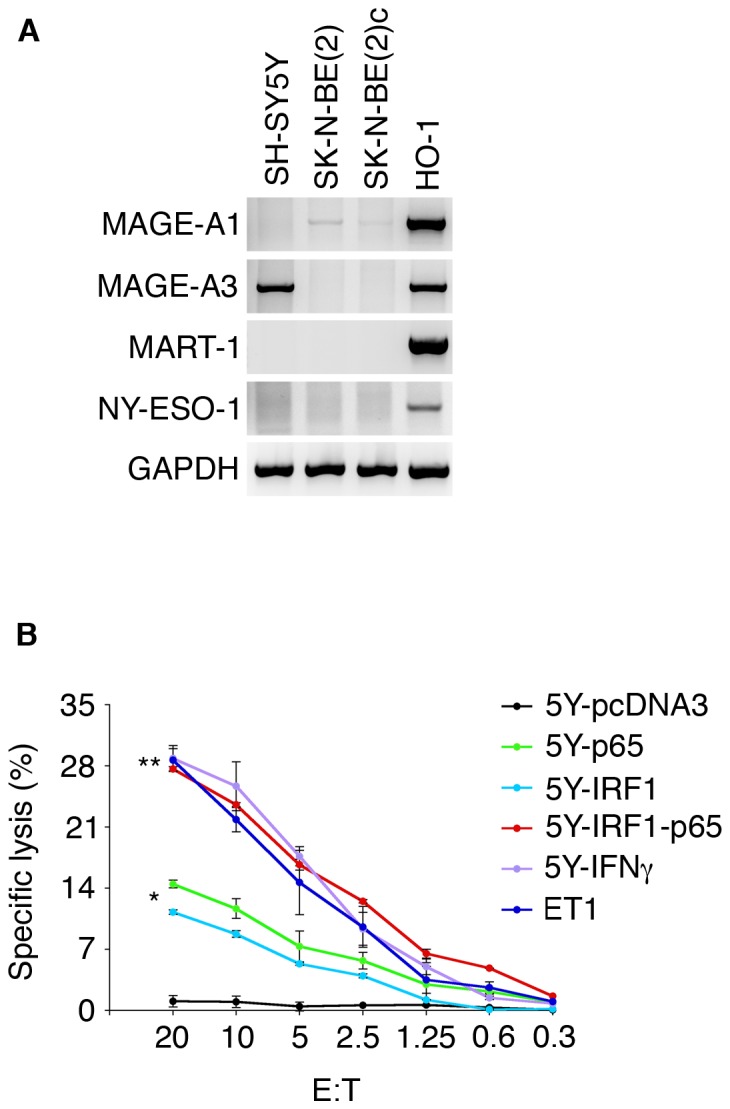
A, RT-PCR analysis of tumor antigens in NB cell lines. The melanoma cell line HO-1 was included as positive control. GAPDH gene expression was used for normalization. B, the SH-SY5Y cell line (5Y) grown in the presence of IFN-γ (5Y-IFN-γ) for 48 hours or co-transfected with IRF1 (5Y-IRF1) and the NF-kB p65 subunit (5Y-IRF1-p65, and 5Y-p65 respectively) or empty vector (5Y-pcDNA3) was assayed by either MHC-I expression (Fig. S6B) by flow cytometry or as targets to HLA-A1-restricted/MAGE-A3-specific CTLs at the indicated effector:target (E:T) ratios in a standard 51Cr-release assay. Statistically significant differences are indicated (*, P<0.002, **, P<0.0000002). Mean ± SD of three experiments is shown. Data shown in A and B are representative of 3 experiments.