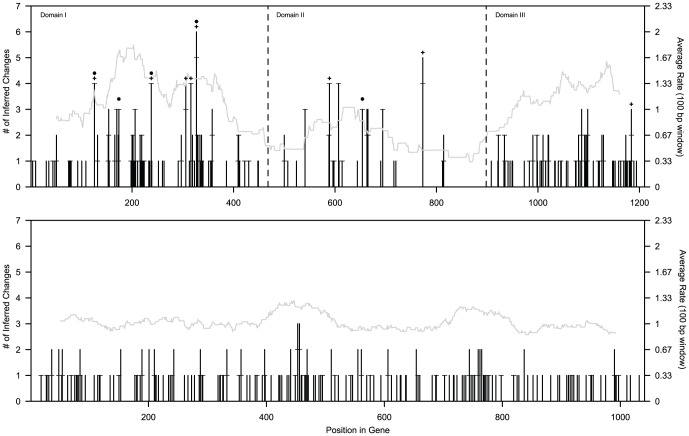
Figure 4. Rate heterogeneity in Agelaius control region and ND2.
Shown are the inferred number of changes per site (left axis and black line; based on marginal reconstruction of ancestral states on arbitrarily-chosen ML trees) in the alignment of Agelaius CR (above) and ND2 (below), and sliding window analysis (plotted at the center of each window, width = 100 bases, step = 1 base) of site-specific rate estimates (right axis and gray line; empirical Bayes estimates from PAML 4.4, correlation of true and estimated rates was 0.583 for CR and 0.545 for ND2). Asterisks mark five hotspots identified by polymorphism within both A. phoeniceus and A. tricolor, and plus symbols mark “hypervariable” CR sites (defined as sites in the 95th percentile or higher of site-specific rate estimates for variable sites). Horizontal lines on bars for individual site change reconstructions indicate the number of intraspecific mutations as opposed to fixed differences between species.

