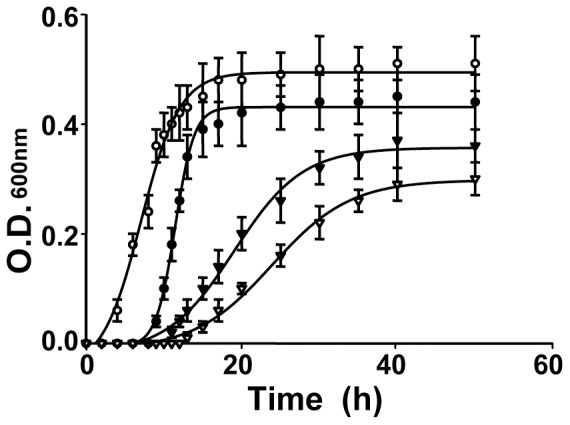
Figure 1. The growth curves of T. maritima at different culture temperatures.

The sample collections and the curve fittings were described in “Materials and Methods”. The symbols of “▿”, “▾”, “○”and “•” represent the bacteria cultured at 60, 70, 80 and 90°C, respectively.
