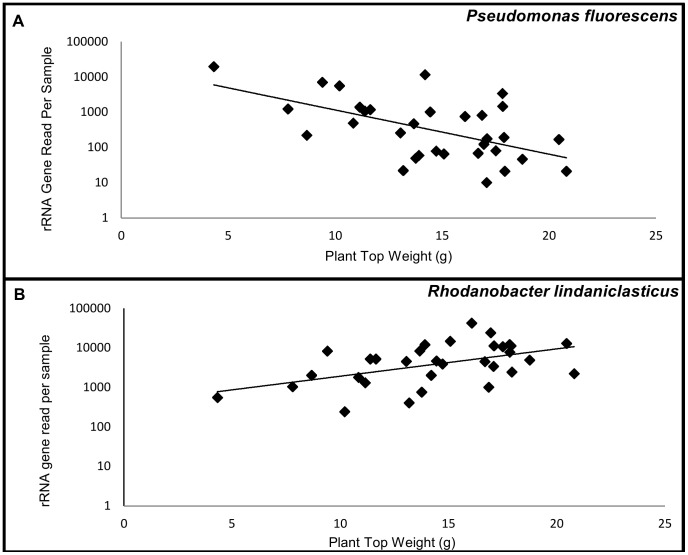
Figure 4. Relationships between bacteria and fresh peach shoot weights.
A. Pseudomonas fluorescens. B. Rhodanobacter lindaniclasticus. Regression equations are (A) [log10 reads per sample = 4.02−0.146 (grams of shoots); P = 0.015; R2 = 18.3%, n = 32] and (B) [log10 reads per sample = 2.59+0.069 (grams of shoots); P = 0.004; R2 = 25.0%, n = 32]. Lines are from regression analyses.

