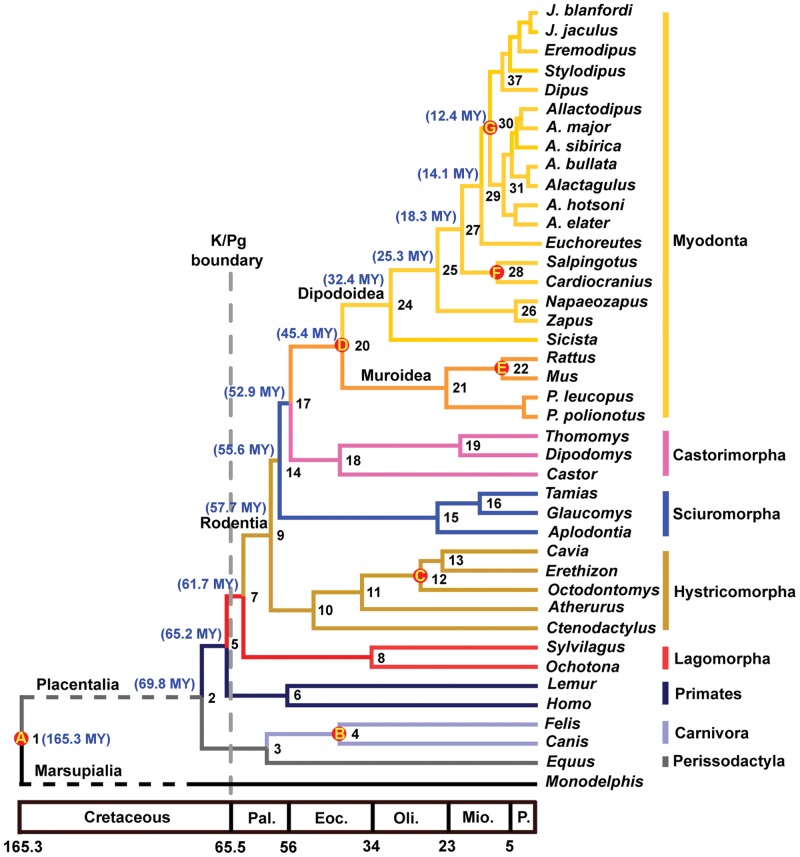
Figure 2. Molecular time scale for the orders of Rodentia, Lagomorpha, Primates, Carnivora and Perissodactyla obtained from the Bayesian estimates based on seven fossil calibration points and relaxed molecular clock model.
Fossil constraints are indicated by circle A to G on the corresponding nodes: A. 160–190 Ma for the split between Placentalia and Marsupialia; B. 38–61.7 Ma for the split between Caniformia and Feliformia; C. 28.5–37 Ma for the split between Octodontomys and Erethizon; D. 43–54 Ma for the basal split of Myodonta; E. 7.3–12.2 Ma for the split between mice and rats; F. 9–13 Ma for the split between Cardiocranius and Salpingotus; G. 10.5–13 Ma for the split between Dipodinae and Allactaginae.

