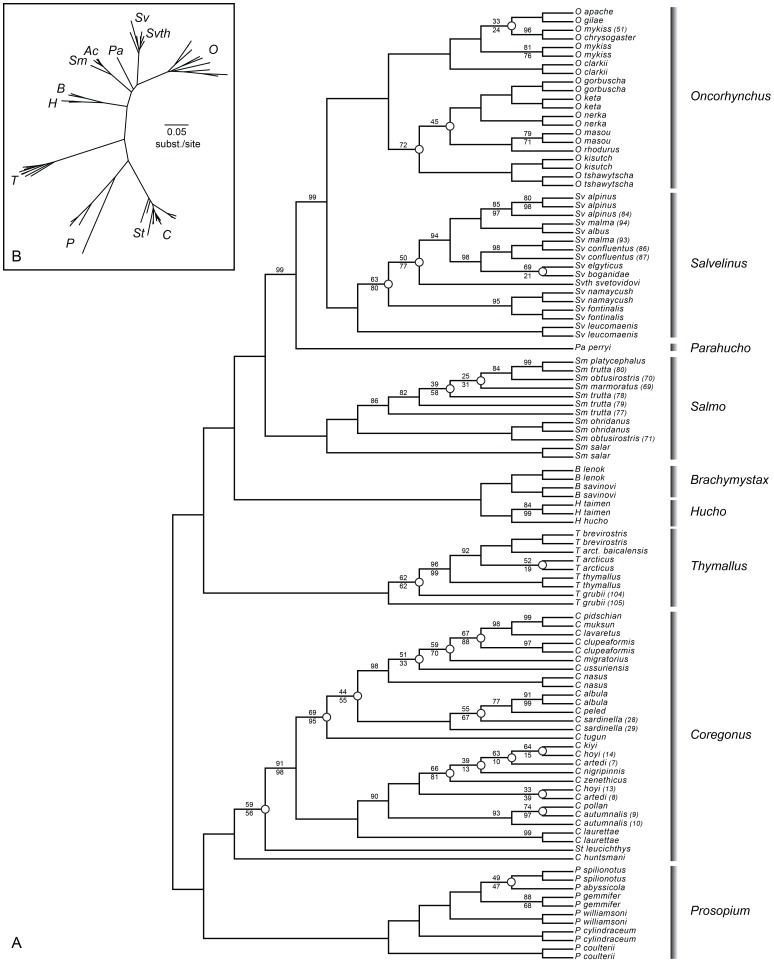
Figure 3. ML tree inferred by the MitoNuc-NT data set with 1 model of molecular evolution.
A: Nodes with less than 75% bootstrap support are indicated by open circles (n = 24). Bootstrap values less than 100% are denoted above branches and posterior probabilities less than 100% for BAY analyses are shown under branches. B: Radial view of the same tree.

