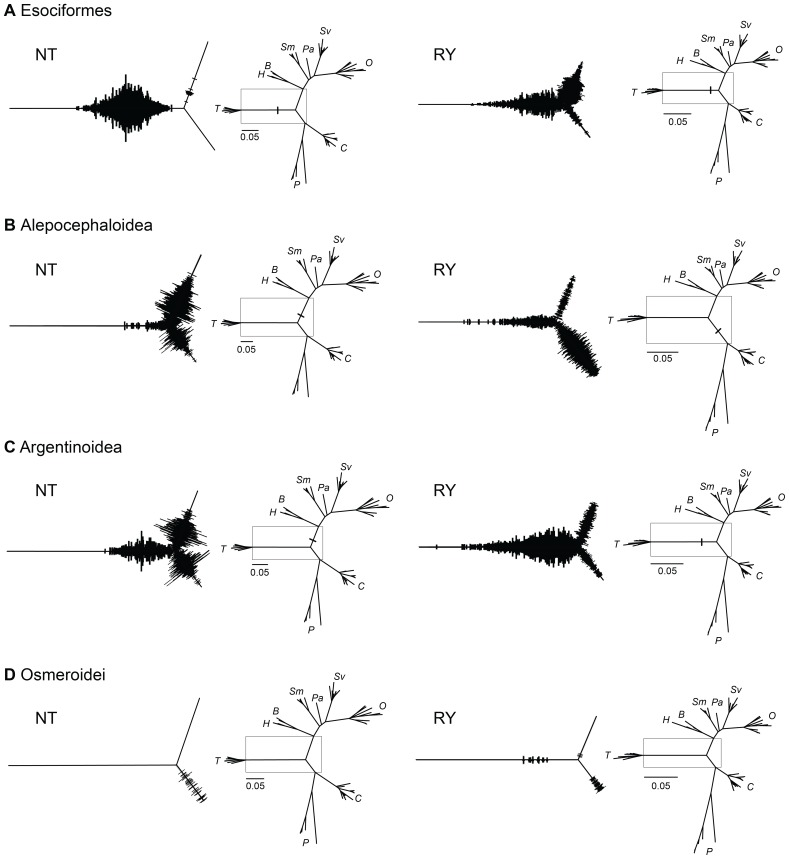
Figure 5. Alternative rooting for Salmonidae based on posterior probabilities of 10,000 MC3 trees.
Boxes on radial phylograms indicated the location of the magnified areas to the left of each tree. The width of the branches indicates posterior probabilities for the position of the outgroup and the length of the branches represents the average of the posterior distributions. Trees in the left column show inferences for NT matrices; trees in the right column show inferences for RY matrices. A: Esociformes: NT 99.1% RY 57.9% (Thymallinae); NT 0.9% RY 35.2% (Salmoninae); RY 6.9% (Coregoninae); B: Alepocephaloidea: NT 3.5% RY 11.8% (Thymallinae); NT 61.6% RY 4.8% (Salmoninae); NT 34.8% RY 42.6% (Coregoninae); C: Argentinoidea: NT 22.5% RY 67.8% (Thymallinae); NT 41.4% RY 13.9% (Salmoninae); NT 33.1% RY 7.3% (Coregoninae); D: Osmeroidei: RY 0.3% (Thymallinae); RY 0.1% (Salmoninae); NET 2.2% RY 2.2% (Coregoninae).

