Fig. 4.
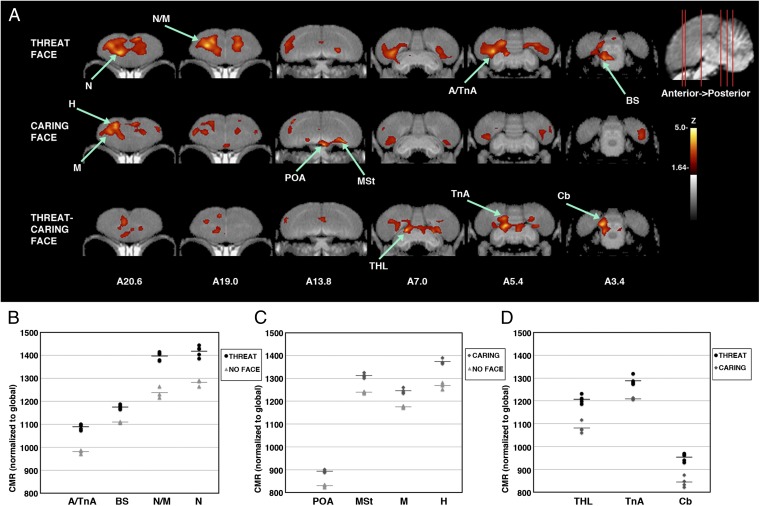
Brain activation patterns from crows shown human faces that have previously threatened or cared for them. (A) As in Fig. 3, voxel-wise subtractions converted to z-score maps are superimposed to a structural MRI template of the crow brain for better anatomical localization. (Top) The activation pattern of crows viewing a threatening face (n = 5) compared with a group shown an empty room (n = 3). (Middle) The activation pattern of crows shown a caring face (n = 4) compared with the empty room group. (Bottom) Voxel-wise direct comparison of the group shown a threatening face with those shown the caring face (the areas activated by threatening and not caring faces are indicated). Coronal slices (from anterior to posterior; coordinates refer to Japanese jungle crow atlas; ref. 31) illustrate peak activations in one or more group subtractions (voxels with Z > 1.64 are colored; those with Z > 3.8 are considered significant with associated structures as indicated). (B–D) Individual values for normalized (global) uptake in each structure that met the threshold for statistical significance on z-score voxel-wise mapping. Horizontal lines indicate group mean. Z values indicated are from peaks in voxel-wise mapping, and P values were derived from one-tailed t test of VOIs centered on peak activation coordinates. (B) Activated structures for threatening face vs. empty room. A/TnA: arcopallium/nucleus taeniae of the amygdala, 11% increased, Z = 4.42, P = 0.00000425; BS: brainstem nuclei surrounding tractus occipitomesencephalicus including nucleus isthmo-opticus, locus coeruleus, and substantia grisea centralis, 5.9% increased, Z = 4.26, P = 0.0000084; N/M: nidopallium/mesopallium, 12.9% increased, Z = 4.14, P = 0.000020; N: nidopallium, 10.6% increased, Z = 3.93, P = 0.000052. (C) Activated structures for caring face vs. empty room. POA: preoptic area, 7.6% increased, Z = 3.99, P = 0.000011; MSt: medial striatum, 5.9% increased Z = 3.94, P = 0.000052; M: mesopallium, 5.9% increased, Z = 3.87, P = 0.000091; H: hyperpallium, 8.3% increased, Z = 3.81, P = 0.000055. (D) Activated structures for threatening face vs. caring face. THL: dorsal thalamus including dorsolateralis posterior thalami, 11.6% increased, Z = 4.18, P = 0.000019; TnA: nucleus taeniae of the amygdala, 6.5% increased, Z = 4.02, P = 0.000033; Cb: cerebellum, 12.9% increased, Z = 3.99, P = 0.000043.

