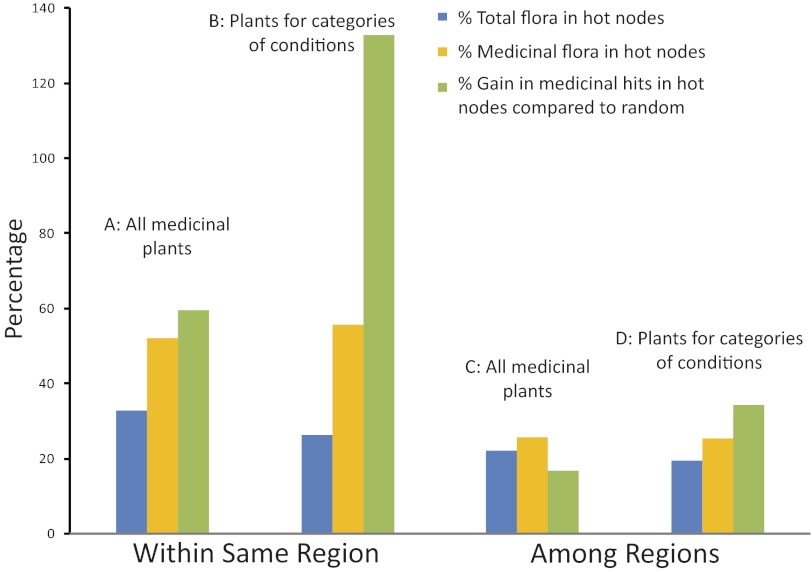
Fig. 2.
Concentration of medicinal plants in phylogenetic hot nodes. Blue and orange bars show percentage of total and medicinal flora included in hot nodes, respectively. Green bars show percentage gain in medicinal plants included in hot nodes. Gain is the difference between the number of medicinal plants in hot nodes, and the number of medicinal plants expected in a random sample of the same size. Within region data (A and B) show the average from the separate values for each of the three regions (Nepal, the Cape of South Africa, and New Zealand). Among regions data (C and D) show the average of pair-wise comparisons on a combined phylogenetic tree of the three floras. These comparisons assessed whether hot nodes from one region can predict medicinal plant use from the other two. Both within region (A and B) and among regions (C and D) hot nodes contain a higher percentage of the medicinal than of the total flora. In all cases (A–D) there is a gain in medicinal hits, compared with a random sample. We show medicinal plants are concentrated in few hot nodes, which overlap noticeably among regions.

