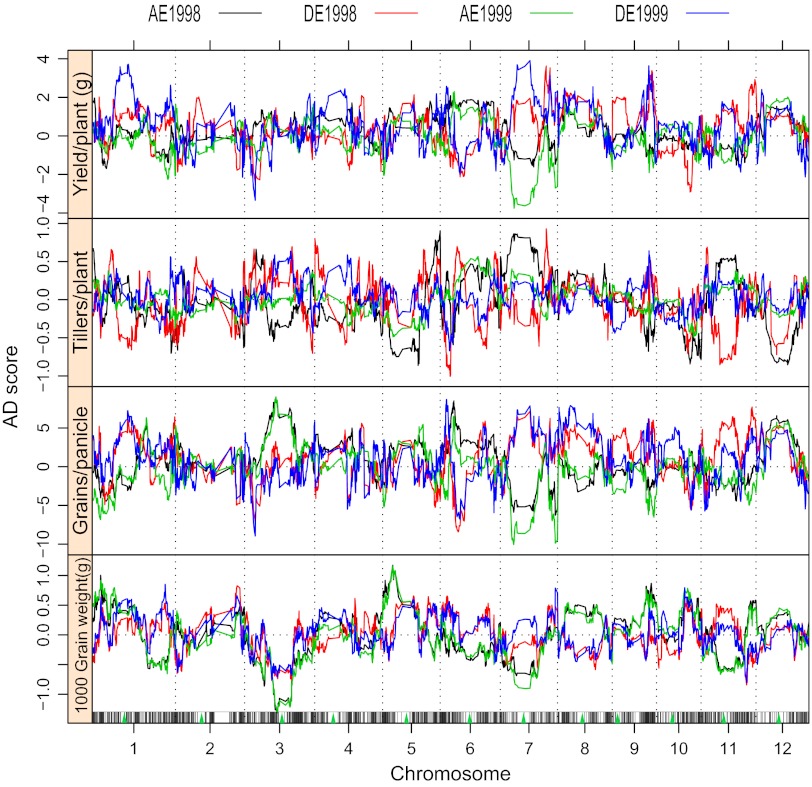
Fig. 1.
Profiles of additive and dominance effects in the entire genome for yield and yield component traits. AE1998, DE1999, etc. indicate additive and dominance effects detected in the data of 1998 and 1999, respectively. AD score refers to the absolute amounts of additive and dominance effects of the trait. Green triangles indicate the centromere positions on the chromosomes.

