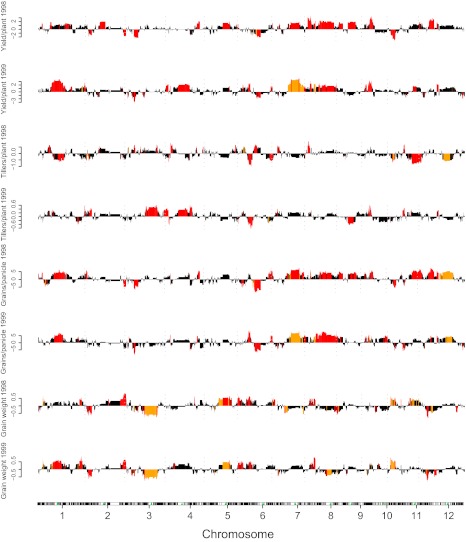
Fig. 2.
Dominance and overdominance in the entire genome for yield and yield component traits. The effects were identified using an h test confirmed by permutation. The adjacent bins that are clustered are separated by columns. The height of the columns shows the dominance values. Red indicates overdominance, and orange indicates partial to full dominance. Black represents statistically insignificant effects. Green triangles indicate the centromere positions on the chromosomes.

