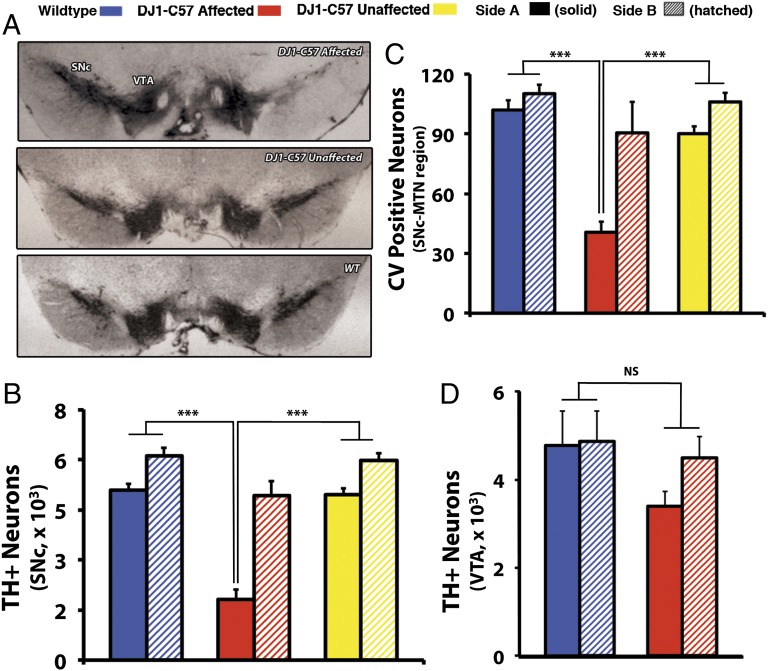
Fig. 1.
Young affected DJ1-C57 mice exhibit selective unilateral degeneration in their SNc. (A) Representative midbrain sections of DJ1-C57 affected (Top), DJ1-C57 Unaffected (Middle), and WT (Bottom) mice depicting TH staining in the SNc and VTA. (B and C) Quantification of A by stereology of total number of TH-positive cells in the SNc (B) and of CV-stained cells at the level of the MTN in the SNc (C). (D) Quantification of TH-positive neurons in the VTA of WT and DJ-1 affected mice. Note that WT, DJ1-C57 affected and DJ1-C57 unaffected are represented by blue, red, and yellow bars, respectively. Side A is depicted as solid shading and side B as hatched shading. NS, not significant (P > 0.05); ***P < 0.001; ANOVA, followed by Tukey’s LSD post hoc tests. Data are represented as means (n = 7–80 per group) ± SEM.

