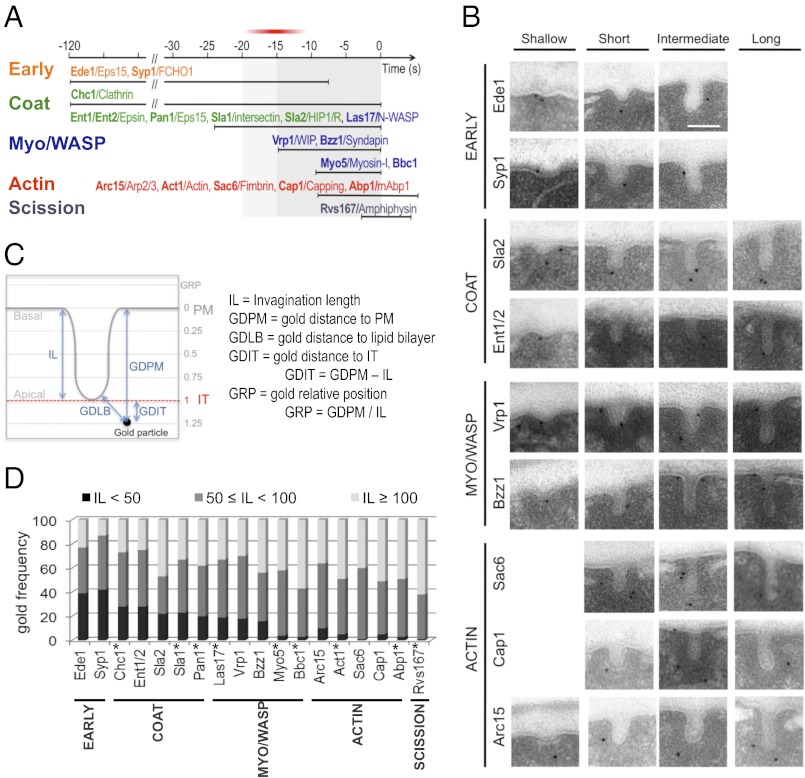
Fig. 1.
The invagination length can be used as a parameter to define the age of the endocytic profiles. (A) Proposed cortical dynamics of endocytic proteins included in the current statistical analysis based on or inferred from live-cell imaging (ref. 2 and references therein). The proteins are grouped in modules (4, 7) represented in different colors. The timing of clathrin recruitment with respect to the early module is not well-defined (4–10). The exact time at which the Arp2/3 complex is recruited with respect to other endocytic proteins is controversial (13, 17). Yeast proteins and their respective mammalian homologs are shown in bold and regular types, respectively. Time 0 corresponds to scission (18). The area highlighted in gray shows the broadest time window analyzed in this study. The red bar indicates when initial curvature may appear. (B) Representative immuno-EM micrographs of ultrathin sections from yeast showing endocytic invaginations of different sizes labeled with immunogolds against the HA tag versions of the indicated proteins. (Scale bar: 100 nm.) (C) Diagram illustrating the parameters used to analyze the position of the immunogolds. The levels of the PM and the invagination tip (IT) are indicated. (D) Relative frequency of immunogolds labeling the indicated proteins binned according to the IL. The number of immunogolds recorded for each protein (ng) was 120. SI Appendix, Fig. S1B shows the GLM analysis of the IL. Proteins labeled with an asterisk were analyzed in ref. 16 and are included as references.

