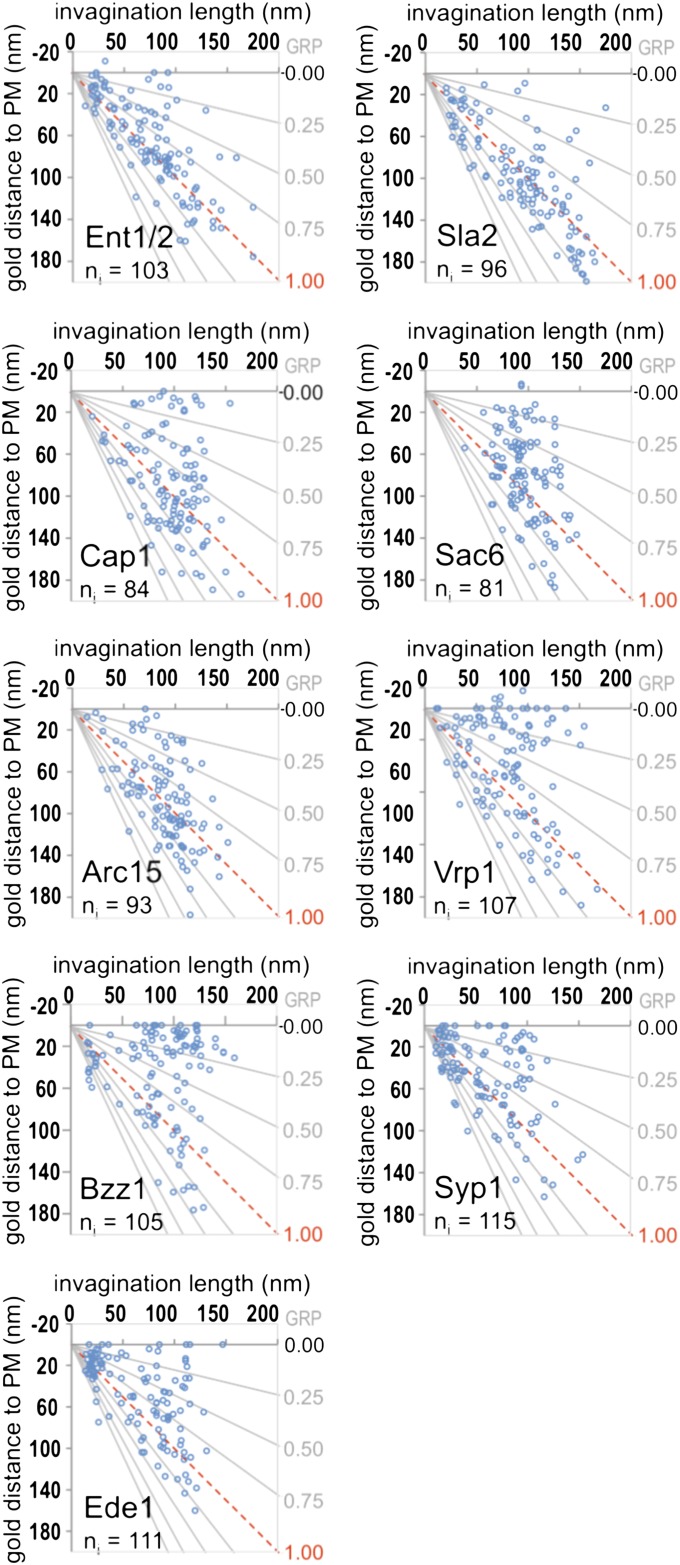
Fig. 3.
Localization of immunogolds labeling endocytic proteins on PM invaginations of increasing length. Scatter graphs showing the GDPM vs. the corresponding IL parameters (parameter definition in Fig. 1C) for each recorded immunogold labeling the indicated proteins. ng = 120 for each protein. The number of invaginations (ni) associated with the recorded immunogolds is indicated. The x axis corresponds to the level of the basal PM. The red dotted line indicates the position of the IT. The gray lines converging at the origin define constant GRP values.

