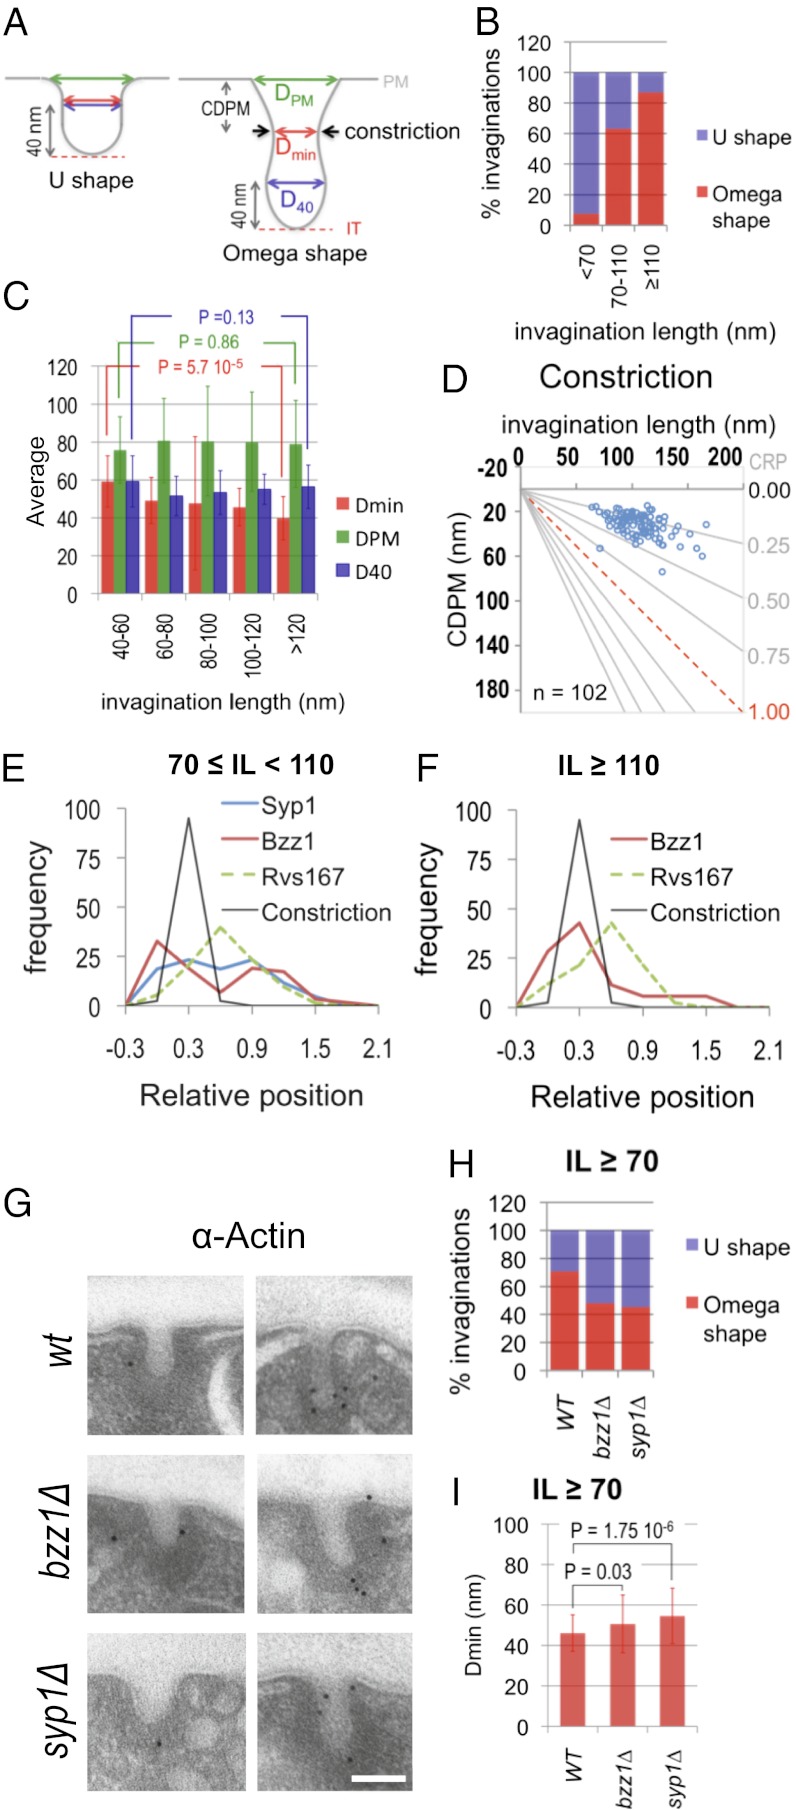
Fig. 5.
Constriction of the endocytic invaginations correlates with the translocation of F-BAR proteins to the profile neck. (A) Diagram illustrating the two main shapes adopted by the yeast endocytic profiles. The invagination geometry is defined by Dmin, DPM, and D40. Invaginations were defined as ω-shaped when Dmin was smaller than D40. Black arrows indicate the position of the constriction. CDPM is the distance from the constriction to the PM. (B) Percentages of ω- vs. U-shaped invaginations as a function of their length. The number of invaginations analyzed was 26, 95, and 46 for the IL bins <70, 70–110, and ≥110 nm, respectively. Data were randomly collected from immuno-EM micrographs of invaginations of WT cells labeled with immunogolds against different HA-tagged endocytic proteins (n = 167). (C) Averages and SDs for the Dmin, DPM, and D40 of endocytic invaginations binned according to their length. Student t test P < 0.005 indicates a very significant difference. Invaginations analyzed were the same as in B. (D) Graph representing the CDPM plotted against the IL. n represents the number of the constricted invaginations analyzed. The x axis represents the level of the basal PM. The red dotted line indicates the positions of the IT. The gray lines converging at the origin define constant CRP values (CRP = CDPM/IL). (E and F) Graphs showing the relative frequency of immunogolds labeling Syp1, Bzz1, and Rvs167 binned according to their GRP and the relative frequency of the constriction according to its relative position (CRP) corresponding to invaginations with 70 ≤ IL < 110 nm (E) and IL ≥ 110 nm (F). Dashed graphs indicate proteins previously analyzed in ref. 16. SI Appendix, Table S5 shows the statistical analysis of the colocalization of the constriction with the BAR proteins. (G) Representative immuno-EM micrographs showing endocytic invaginations from WT, syp1∆, and bzz1∆ strains labeled with immunogolds against actin. (Scale bar: 100 nm.) (H) Percentages of ω- vs. U-shaped invaginations longer than 70 nm for the indicated strains. The number of the analyzed invaginations was 84, 100, and 106 for the WT, bzz1∆, and syp1∆ strains, respectively. (I) Average and SD for the Dmin of endocytic invaginations longer than 70 nm for the indicated strains. Invaginations analyzed were the same as in H. MWW test P < 0.005 indicates very significant differences.

