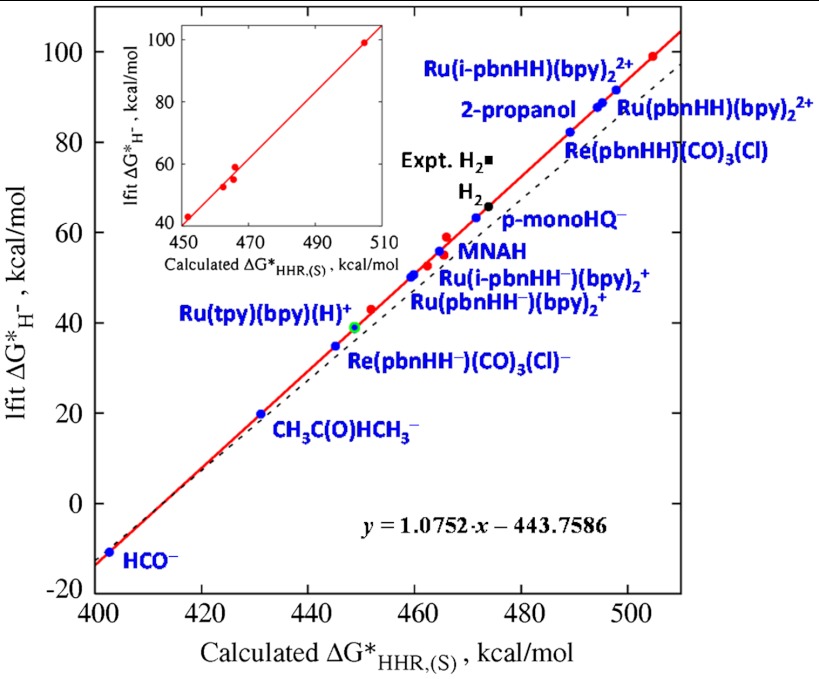
Fig. 3.
Predicted values of  as a function of the computed
  for the five calibration species from Fig. 2 (red points), the least-squares fit to the five calibration points (red line), the predicted values of the additional hydride donors listed in Table 1 (blue points), and the straightforward ΔG∗′(H-) prediction based on Eq. 5 (dashed line). The equation of the least-squares linear fit and the “experimental” (black square) and predicted values (black point) of
  (H2) are also indicated. The experimental value of Ru(tpy)(bpy)(H)+ is indicated by the green open circle. (Inset) Blow-up of the fitted region.

